
Capstone Project -- Factors That Impact Educational Attainment Among Foster Youth
Hello there!
Regardless of whether it was intentional or by chance, I’m very excited that you have come across my blog post for my Capstone Project! In this post, I will describe my final project for the Data Science Immersive program at General Assembly (Summer 2016 Cohort). I will start off with some context, then an overview of my methods and findings, and conclude with some insightful take-aways for the problem I chose to explore. If you want to check out the step-by-step process of the project methodology as well as detailed information over the code and data that was used, head over to my github repository for this Capstone Project: Capstone Github Repo
Here we go!
– Context –
Public Health Issue: Negative outcomes experienced by foster care youth who age out of the system
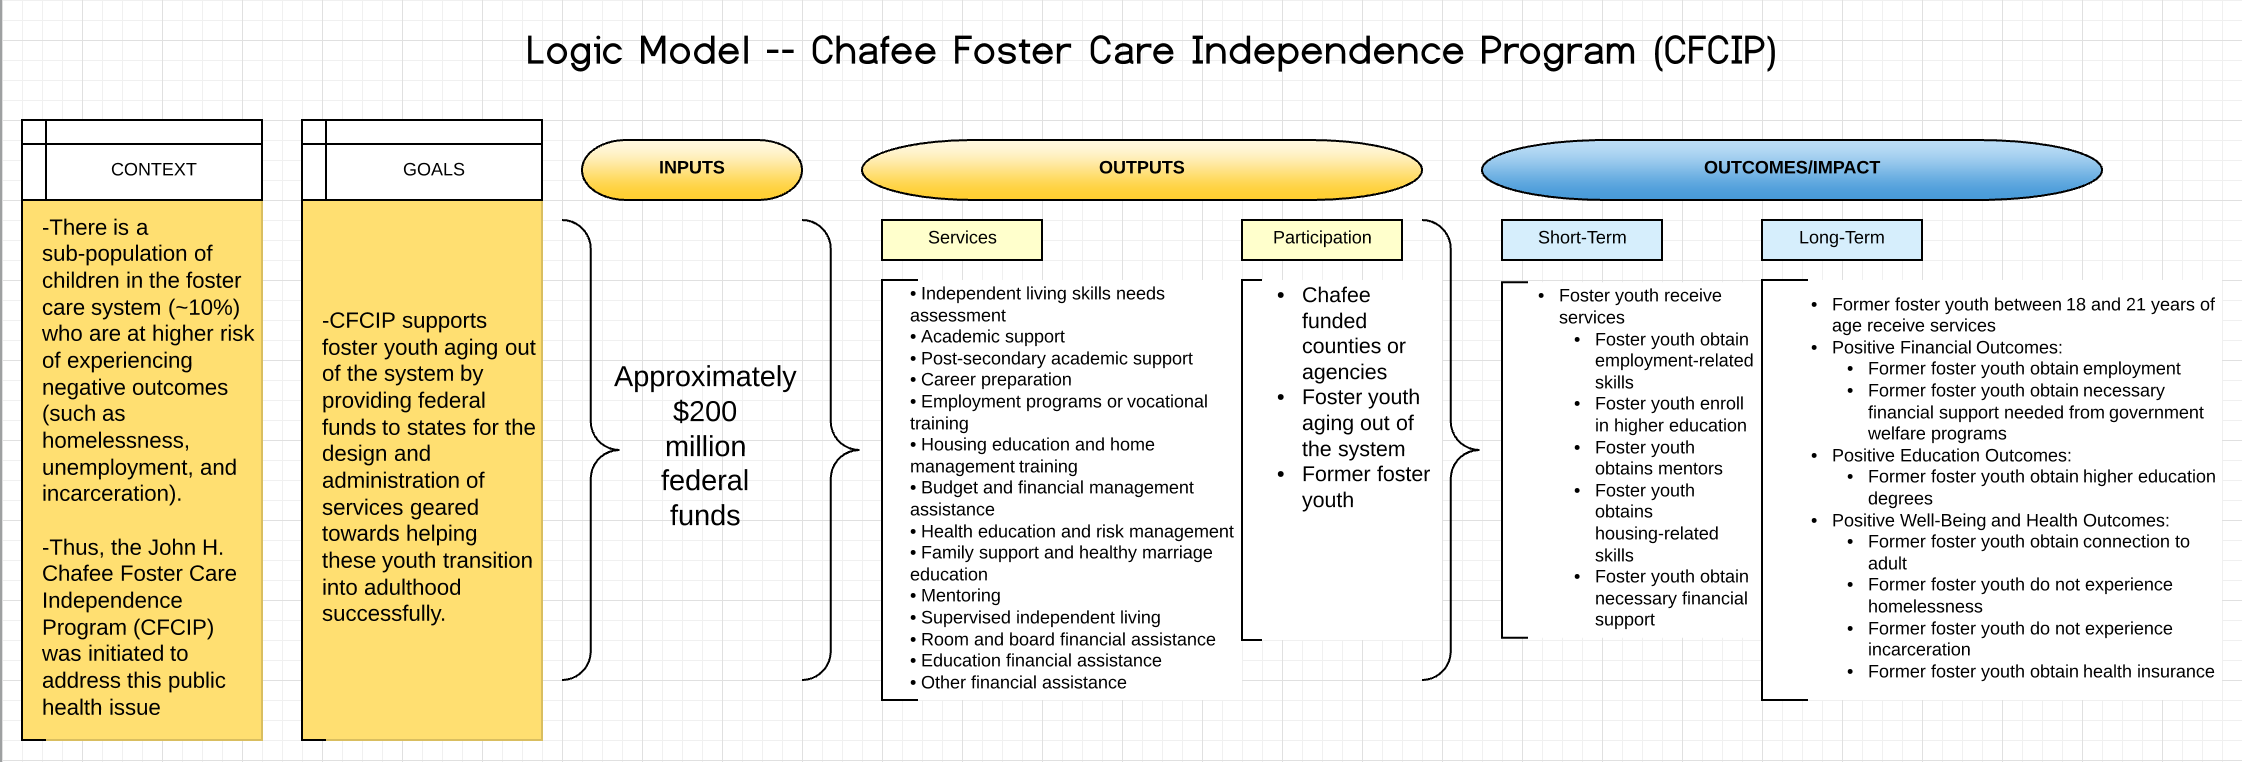
There is a sub-population of children in the foster care system (~10% of the foster care population) who experience a phenomenon known as foster care drift and end up aging out of the system (at age 18) with no permanent home. This sub-population is at a higher risk of experiencing negative outcomes such as homelessness, unemployment, incarceration, and mental health issues because these youth experience extreme instability and usually lack knowledge and skills that lead to self-sufficiency in adulthood.
The John H. Chafee Foster Care Independence Program (CFCIP) was initiated to address this public health issue by providing federal funds to states for the design and administration of services geared towards helping these youth transition into adulthood successfully.
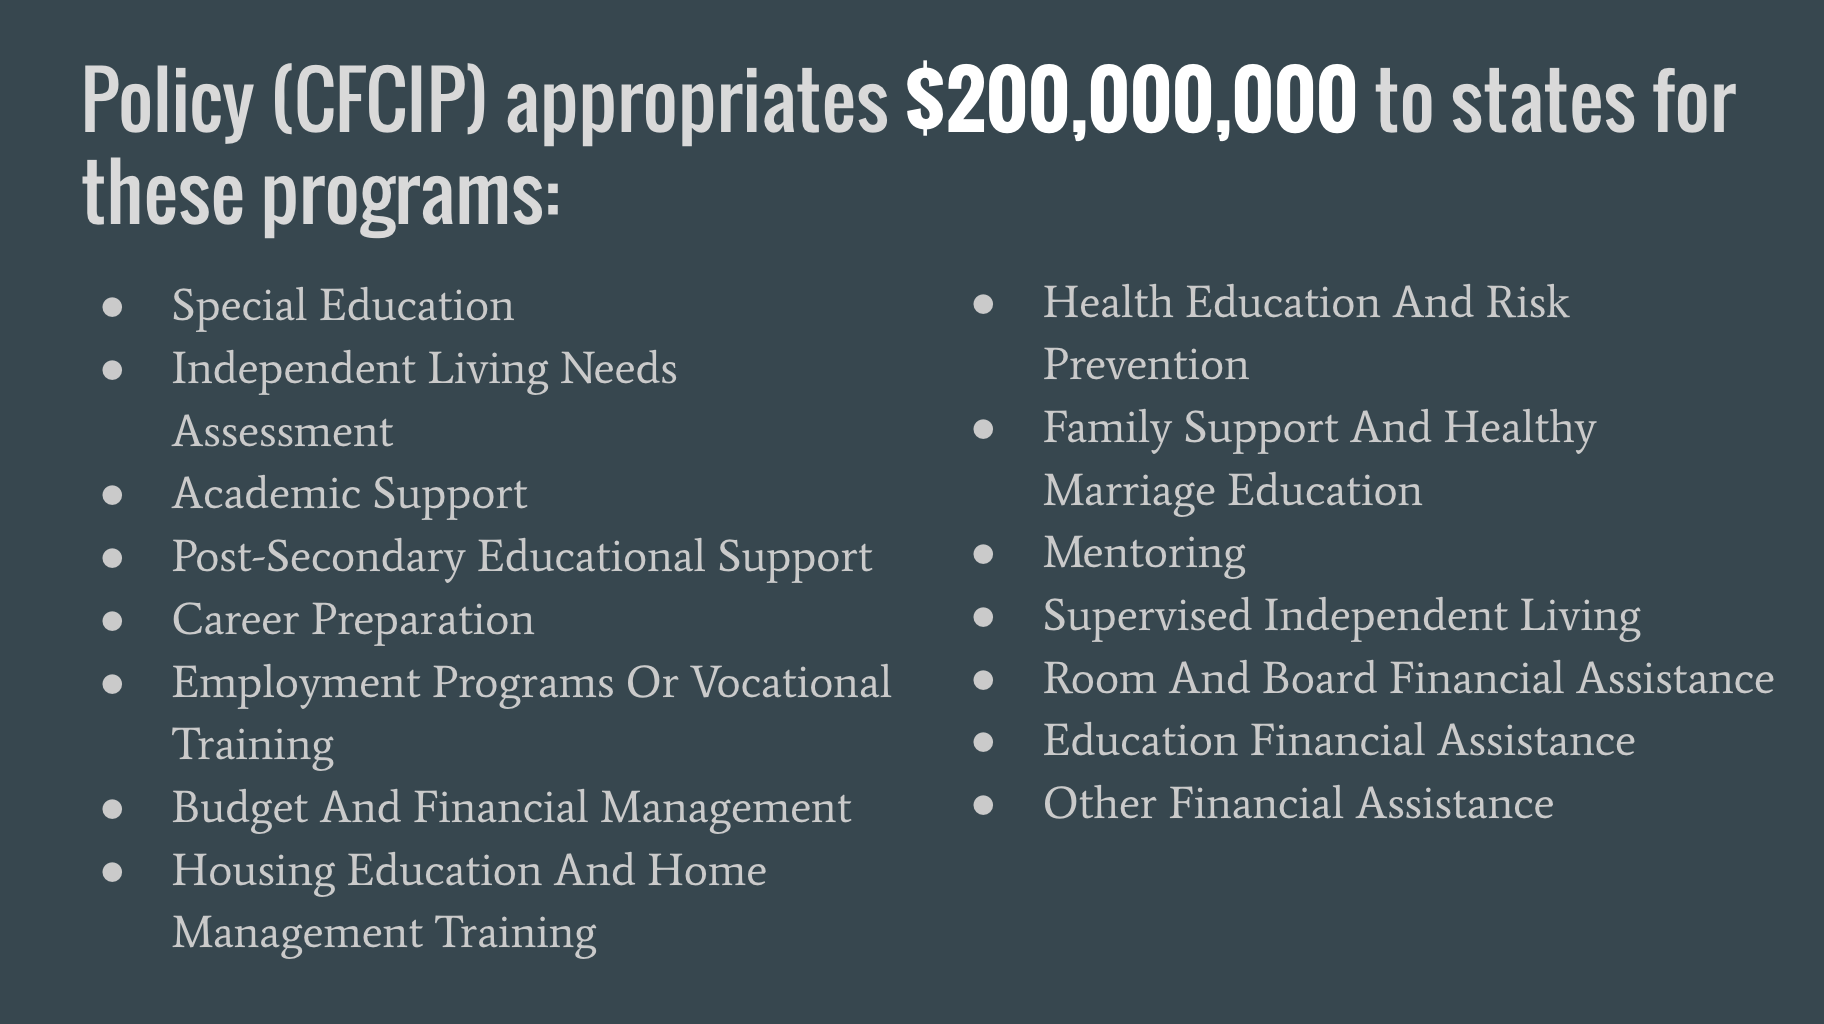
CFCIP considers a former foster youth as successfully transitioned into adulthood if he or she is able to obtain positive well-being, health, education, and finanacial outcomes.
For a more detailed breakdown of the program, check out the logic model below:
– Capstone Project Specific Aims and Problem Statement –
Build and develop a predictive model in order to:
1) Evaluate the John H. Chafee Foster Care Independence Program (CFCIP)
2) Identify which services provided lead to positive educational outcomes
3) Recommend which services to focus funds on
– Problem Statement –
Which services geared towards foster youth aging out of the system lead to positive educational outcomes?
Before I discuss my approach to explore the problem statement, I will describe the dataset used in this analysis.
– Data Used in the Analysis –
Raw Data Source and other references:
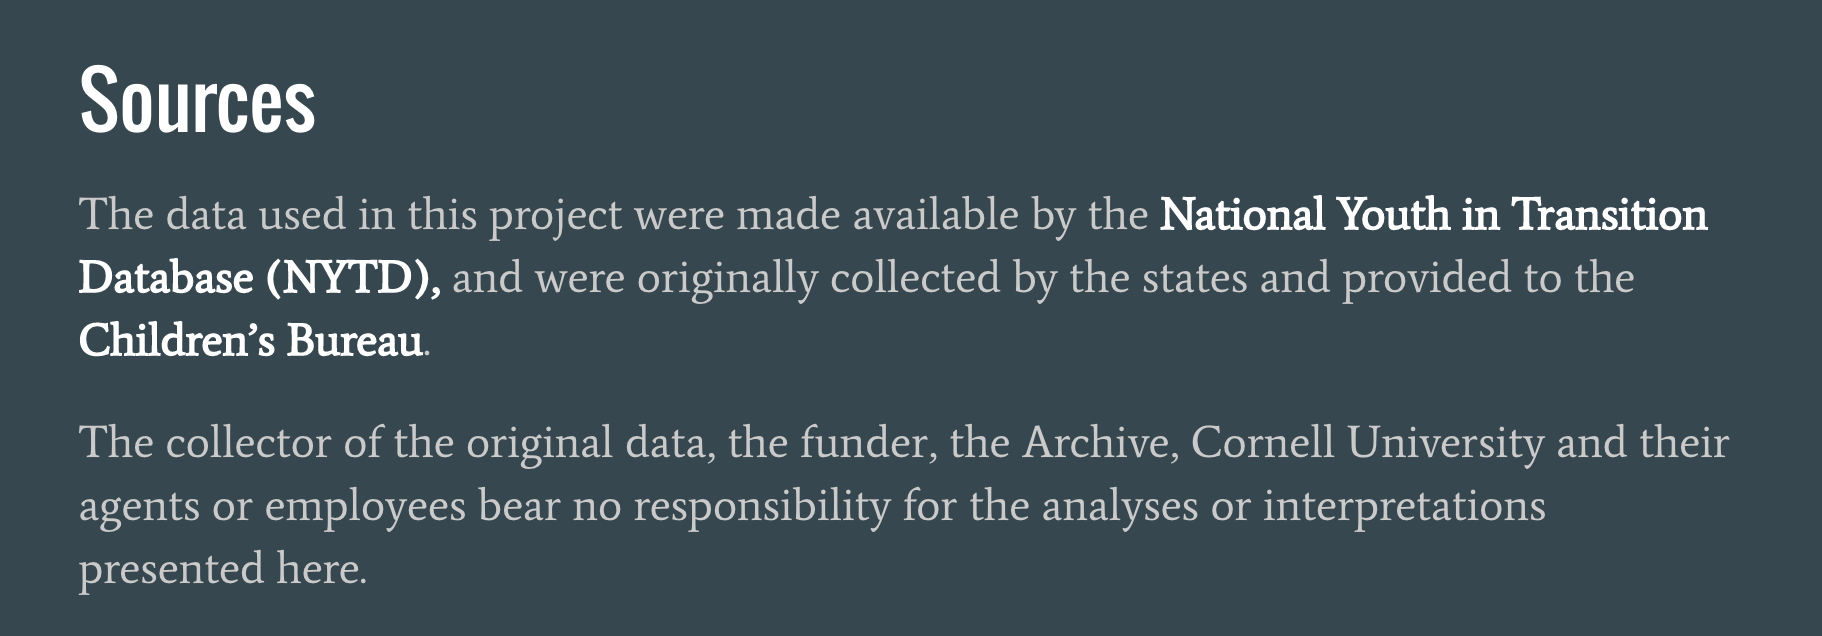
Other Sources:
– Sample Population Analyzed –
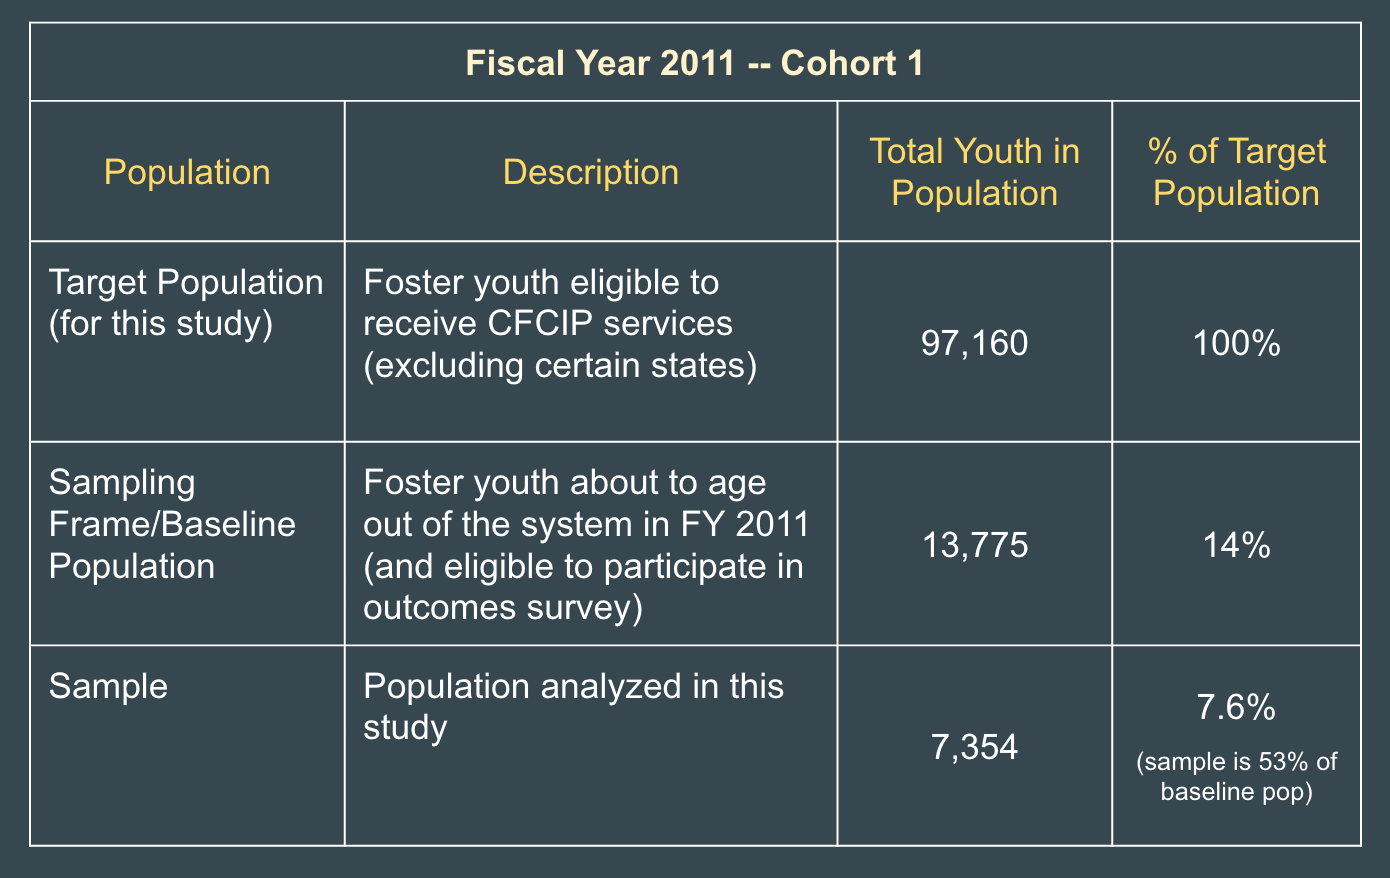
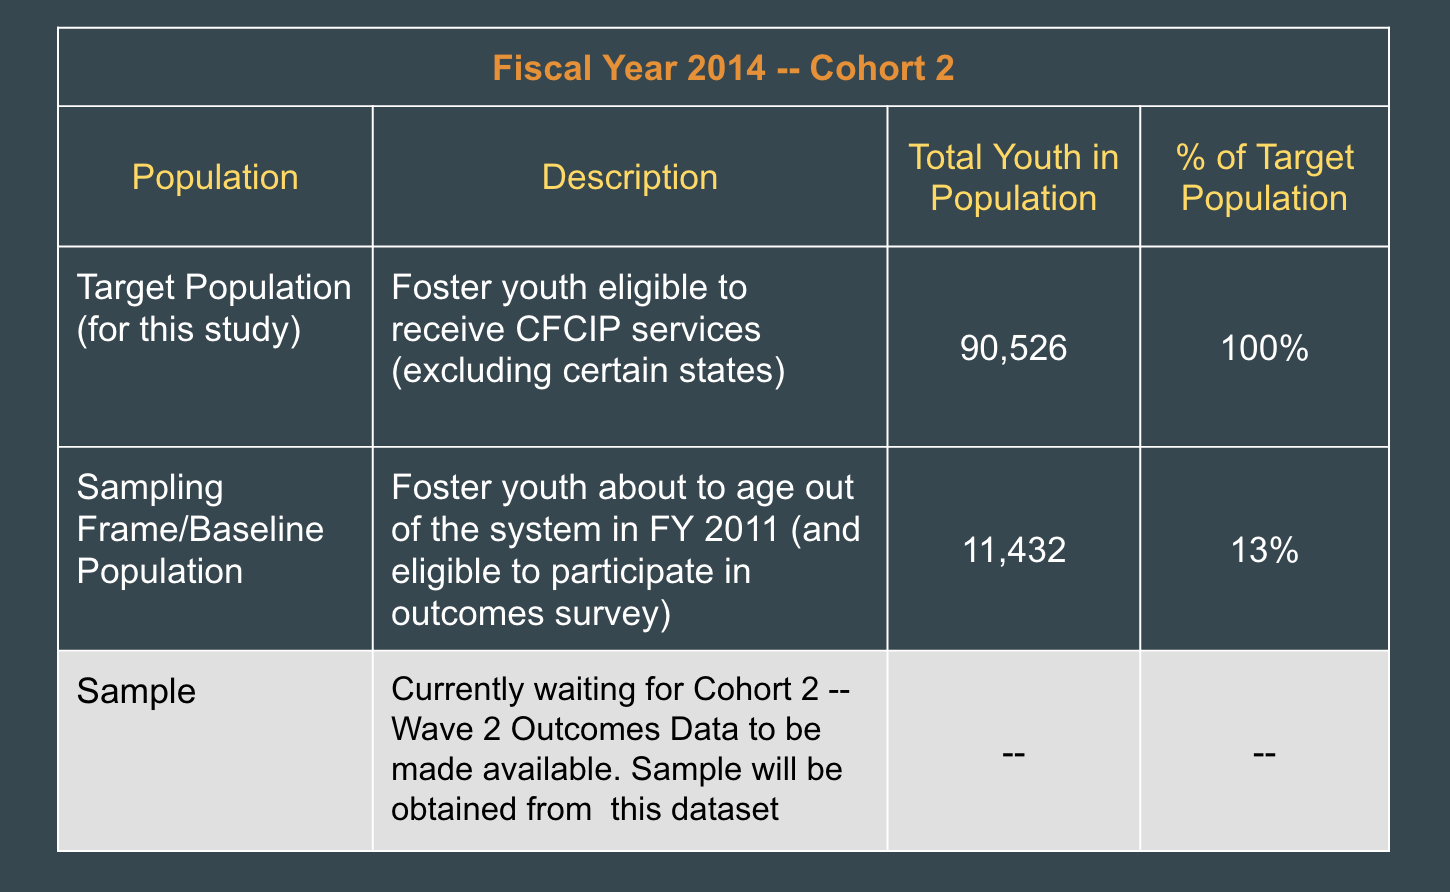
The diagram above illustrates the population that was included in my analysis (i.e. the sample). The tables below describe the populations in more detail.
The target population for this study–foster youth at risk of aging out of the system without a permanent home–is about 10% of the total U.S. Foster Care Population each year.
This sub-popultaion of foster youth are eligible to receive services funded by the Chafee Foster Care Independence Program (CFCIP) mentioned above. The sampling frame, which is also the baseline population in this study, is composed of the foster youth who are age 17 and eligible to receive services.
The CFCIP policy requires that a sample of these foster youth participate in an outcomes survey at age 17, and two follow-up surveys at age 19 and 21. For this project, I will be analyzing outcomes data for those youth who participated in the two follow-up surveys in order to build a predictive model. Later in this blog post, I will discuss the data insights gleaned throughout the process of building the model. I will be building a predictive model based on the Cohort 1 sample–foster youth in the sampling frame for FY 2011. I will evaluate the model’s performance on outcomes data for the Cohort 2 sample–foster youth who received services in FY 2014 and participated in the 2013 follow-up survey–when the data is available (which should be in 2017).
For detailed explanations of population terms (e.g., target population, sampling frame, etc.), check out these websites:
– Data Dictionary, Risks and Assumptions –
For a detailed summary of the risks and assumptions of the data as well as a copy of the data dictionary for the dataset, check out my jupyter notebooks in my github repo: Capstone Github Repository: Data
– Methodology –
1) Exploratory Data Analysis (EDA)
2) Select Target Variable
3) Select Features
4) Build Models
5) Select Model
6) Next Steps
7) Recommendations
1) EDA Highlights for Cohort 1 Sample
UNIVARIATE ANALYSIS:
A) Demographics:
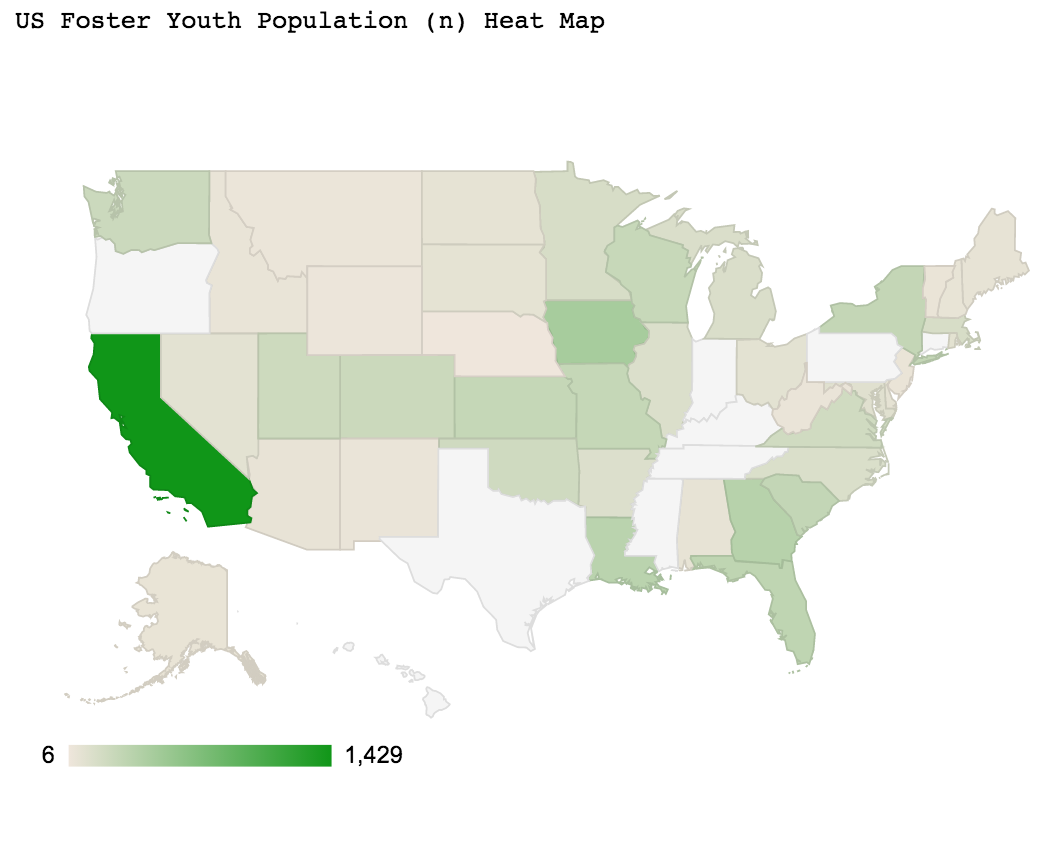
-
California population in sample is an outlier; however, it is proportional to the baseline population (i.e., the sampling frame for California).
**Check out the interactive heat map of the foster youth sample here: US Foster Youth Population (n) - Cohort 1 (2011) - Heat Map
-
Equal distribution of females to males in foster youth sample.
-
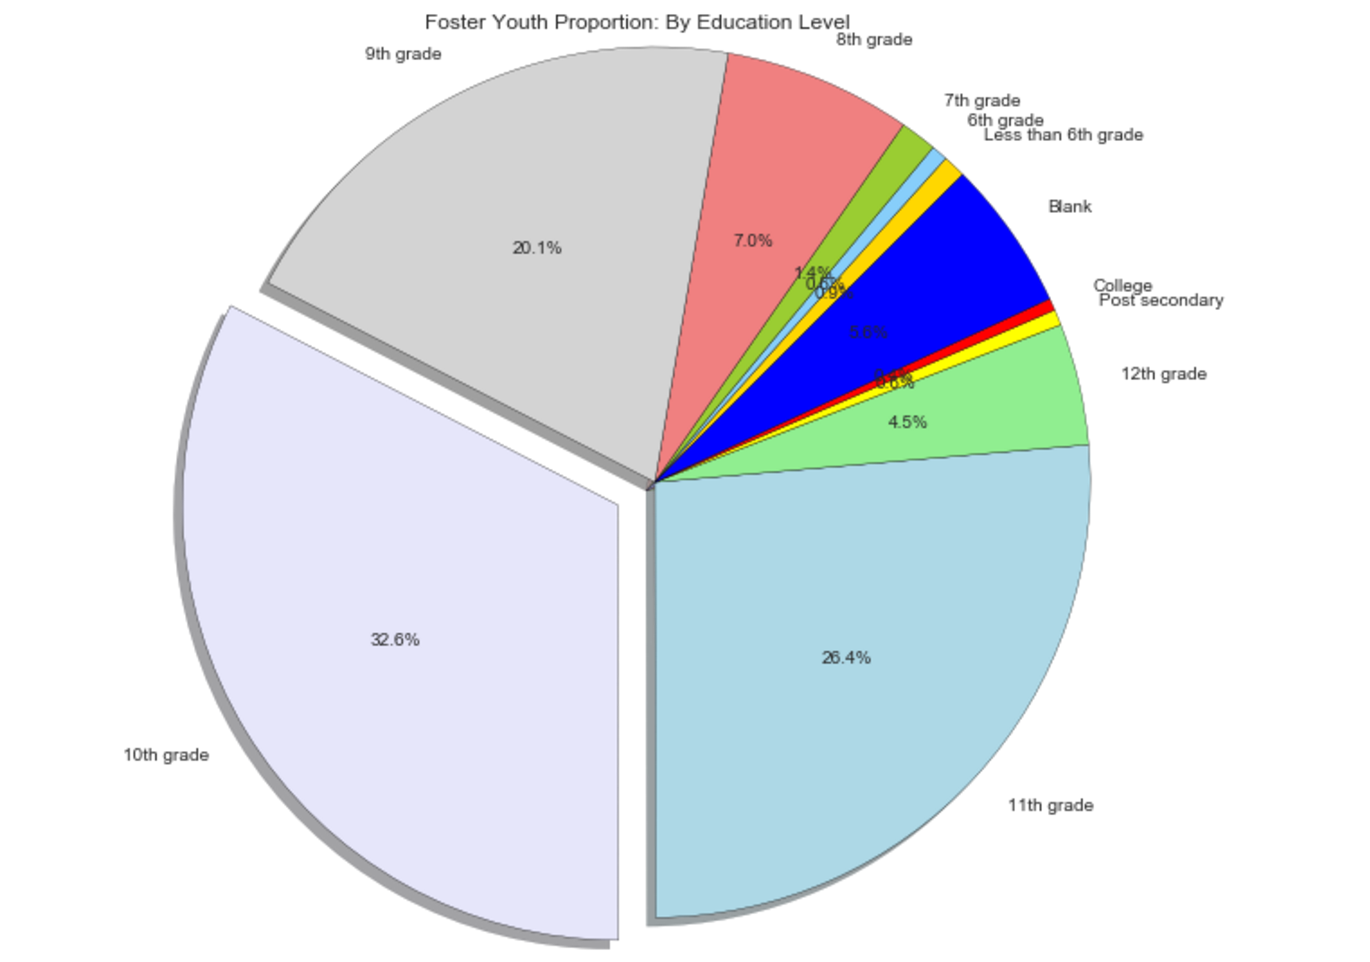
Education Level at Baseline:
About 1/3 of the youth in the sample are in grades that are 3+ yrs away from graduating high school, and so are unlikely to have been at a point where they could enroll in higher education (a target variable) when the first outcomes follow-up survey was administered (2 yrs from baseline year). However, exceptionsare possible and enrollment in vocational training/trade schools is still possible in 2 yrs.
-
About 1/5 of the youth in the sample have been labeled as delinquents
-
93% of the sample are not considered members of a tribe. Unless bivariate analysis shows any interesting correlation with this demographic attribute, I may be able to drop this variable from any further analysis and modeling.
-
About 1/4 of the youth in sample have received Special Education Services.
-
RaceEthn and Race are correlated.
B) Services:
-
Only 1/5 of foster youth in sample received the following services: Post-Secondary Support, Mentoring, and Other Financial Services.
-
Only 1/4 of foster youth in sample received Employee Training Services
-
About 40% of foster youth received the following services: Budget, Housing Education, and Health Education.
-
About 30% of foster youth received Family Support Services
-
Unless bivariate analysis shows any interesting correlation with the following variables, I may be able to drop them from any further analysis and modeling:
-
About 90% of the sample did NOT receive the following services: Supervised Independent Living and Room and Board Financial Aid.
-
About 84% of the sample did NOT receive Education Finance Services.
-
-
The following services are about evenly distributed between yes and no responses: Independent Needs Assessment, Academic Support, and Career Services.
-
For this sample, distribution of number of services received is overall normally distributed:
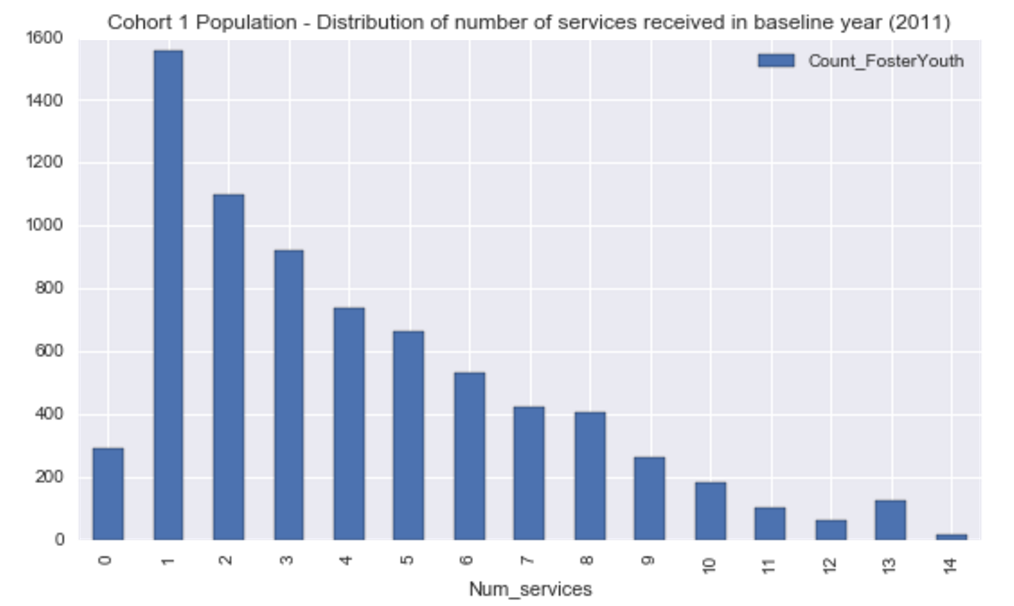
- The majority of youth in the sample received one service (21.2%),
with a small, but notable spike at 13 services received.

- About 4% of youth in the sample received no services at all.
C) Outcomes:
-
Majority of youth in sample are NOT receiving:
- Public Food Assistance
- Public House Assistance
- Public Financial Assistance
- Other Financial Assistance
- Other Health Insurance
-
Majority of youth in sample are NOT:
- Employed full-time or part-time
- Of those youth who are employed, 2/3 are employed part-time
- Employed full-time or part-time
-
Majority of youth in sample DO:
- Have MDCD insurance
- Have a connection to an adult
-
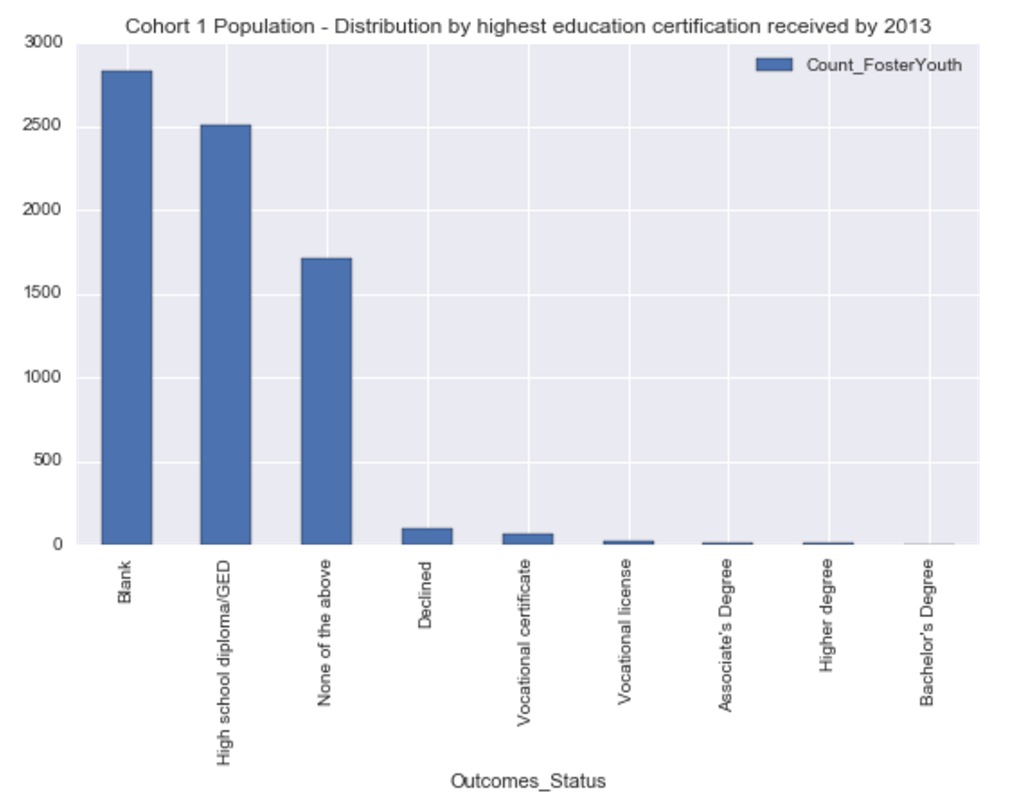
Higher Education Certification:
- Majority of youth in sample have a High School Diploma or a GED
- 1.3% of youth have some form of higher education
-
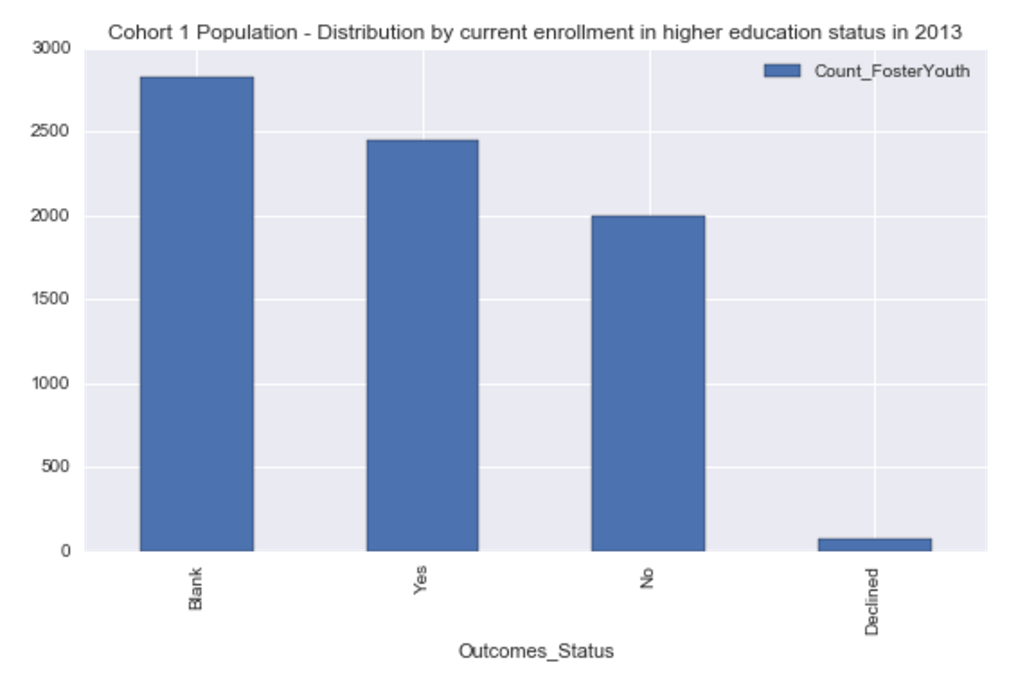
Currently enrolled in higher education:
- Of those youth who responded to this question:
- 55% of youth were currently enrolled in a higher education program
- Of those youth who responded to this question:
-
Obtained employee skills:
- Of the youth who responded to this question:
- About 1/3 responded yes
- Of the youth who responded to this question:
-
Experienced homelessness, substance abuse, or incarceration:
- Of the youth who responded to these questions:
- 20% experienced homelessness
- 14% were substance abusers at one point
- 20% experienced incarceration
- Of the youth who responded to these questions:
-
I plan to drop the following variables since they were not applicable to a majority of youth in the sample:
- Mental Health Insurance
- Medical Insurance
BIVARIATE ANALYSIS:
A) Demographics vs Features:
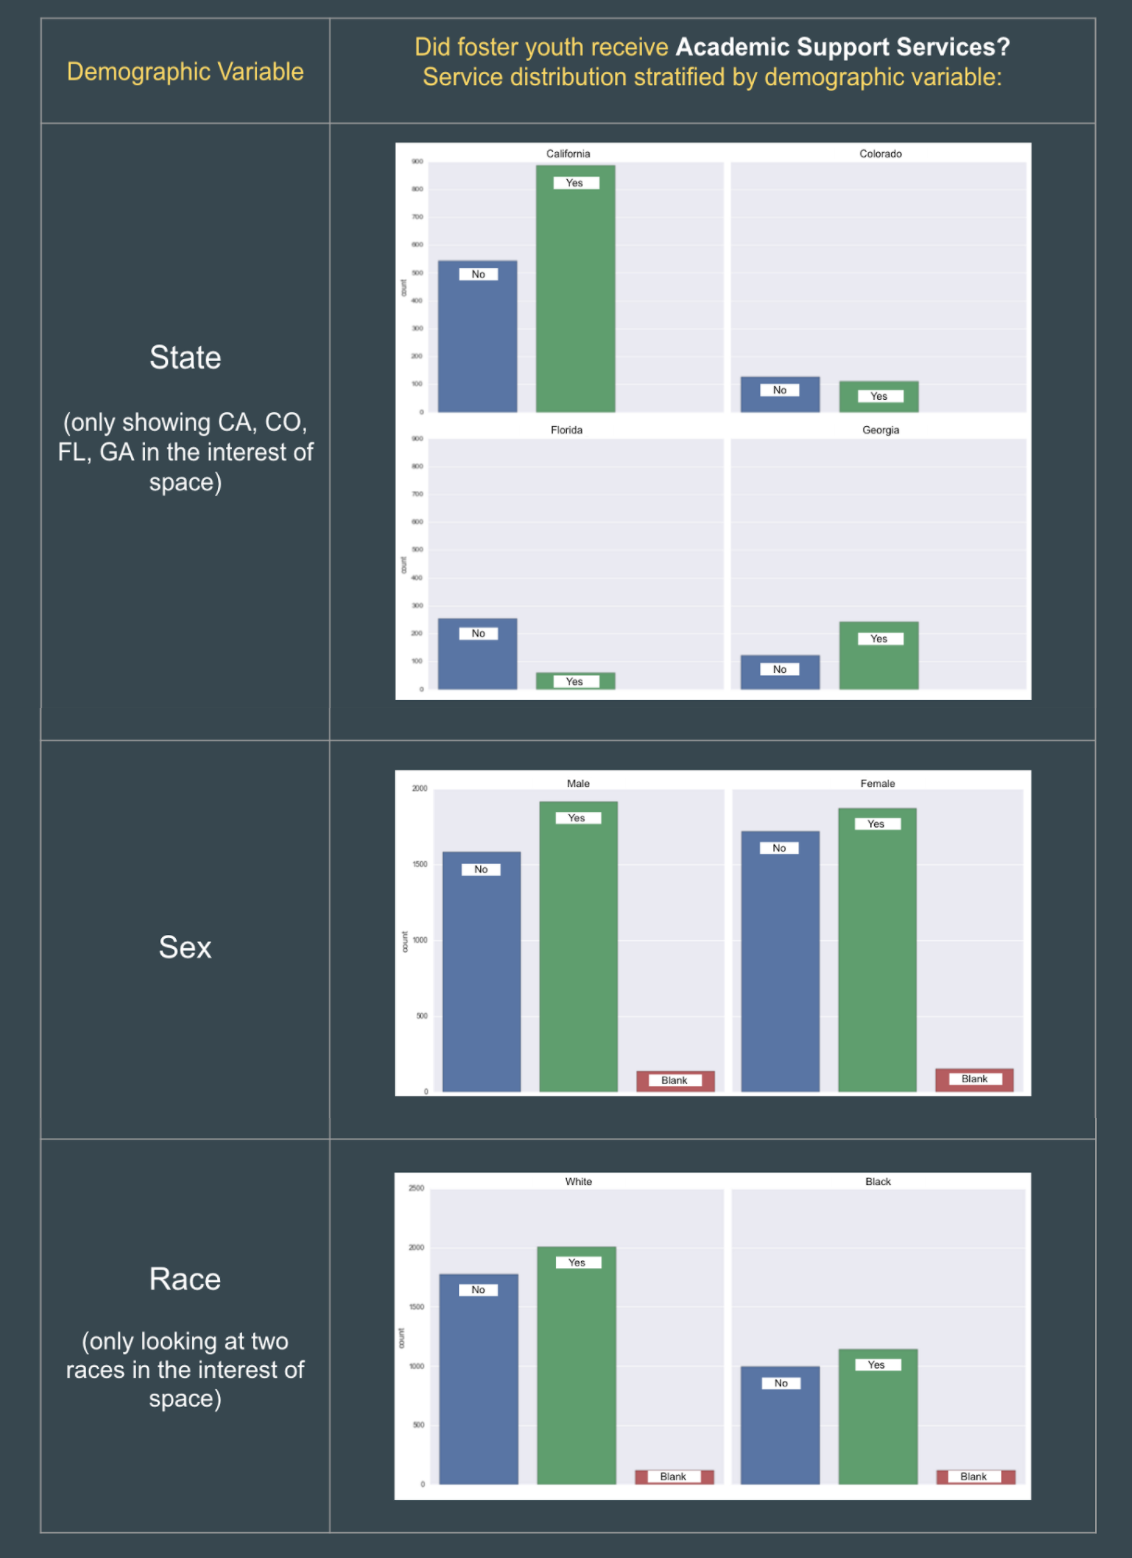
Out of all the demographic attributes (Sex, Race/Ethnicity, Grade Level, etc.), the variable ‘State’ was the only one in which the follwoing service distributions varied significantly:
- Independent Living Needs Assessment
- Academic Support
- Career Training
- Employee Training
- Budget Training
- House Education
- Health Education
- Family Support
- Other Financial Support

- The bar charts below demonstrate one example of how the service
distributions varied by State and not by other demographic variables.
Below, we can see that the likelihood of a foster youth receiving Academic
Support was heavily dependent on the State rather than a youth's gender or
race.
Majority of STATES did not provide much of the following services:
- Post-Secondary Education Support
- Mentoring, Supervised Independent Living
- Room and Board Financial Assistance
- Education Financial Services

** Iowa was an outlier, providing more of these services.
Iowa also had disproportionately higher frequency of administering
13 services per youth.
B) Demographics vs Targets:

C) Features vs Targets:
Outcome distributions varied by services received for the following services:
- Highest Education Certification
- Current Enrollment in Higher Education
- Current Part-Time Employment
- Employee Skills
- Public Food Assistance
One main take-away from the Features by Targets Bivariate Analysis: May need to drop blanks/Declines/Etc.
– Selecting the target variable for the analysis –
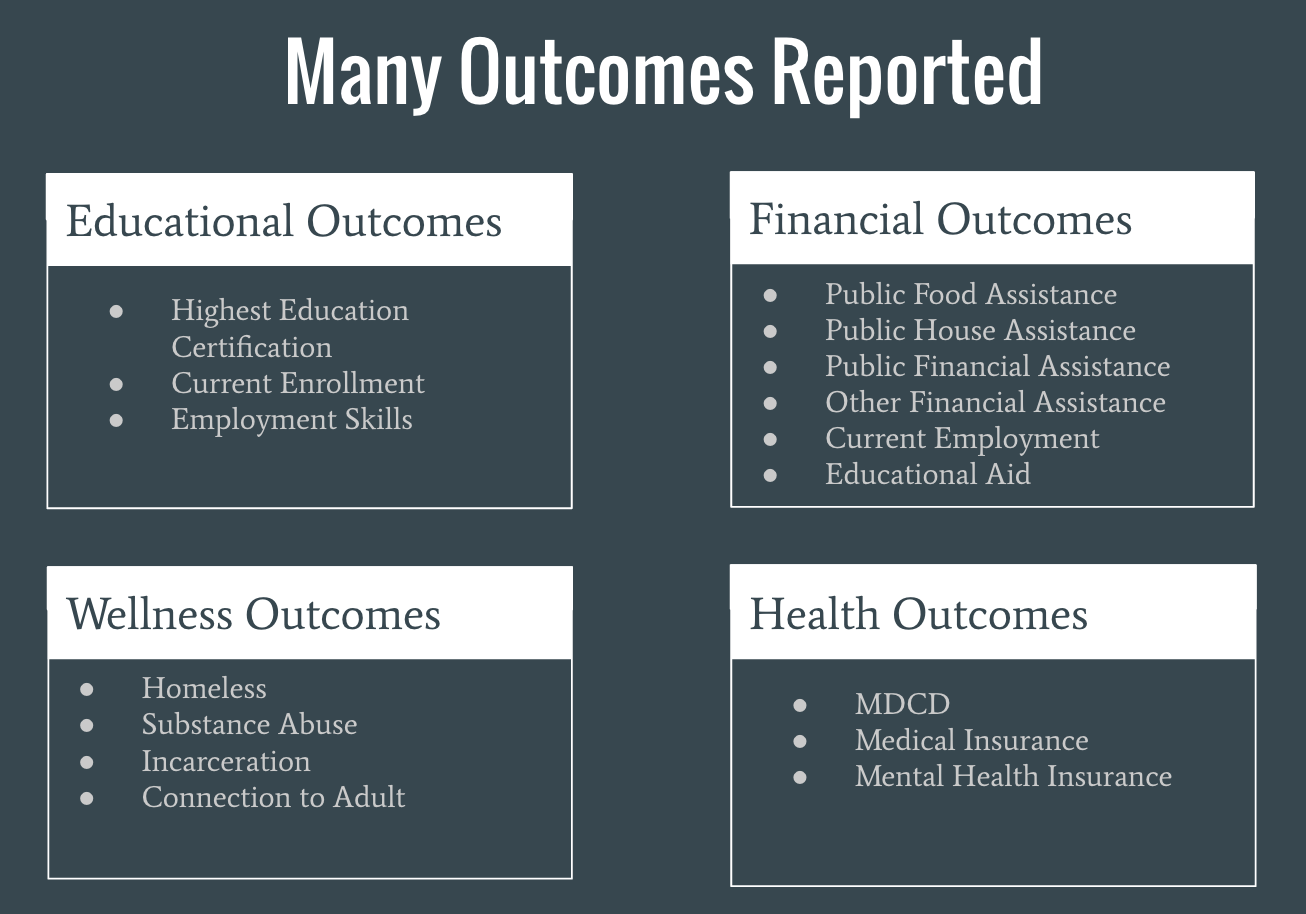
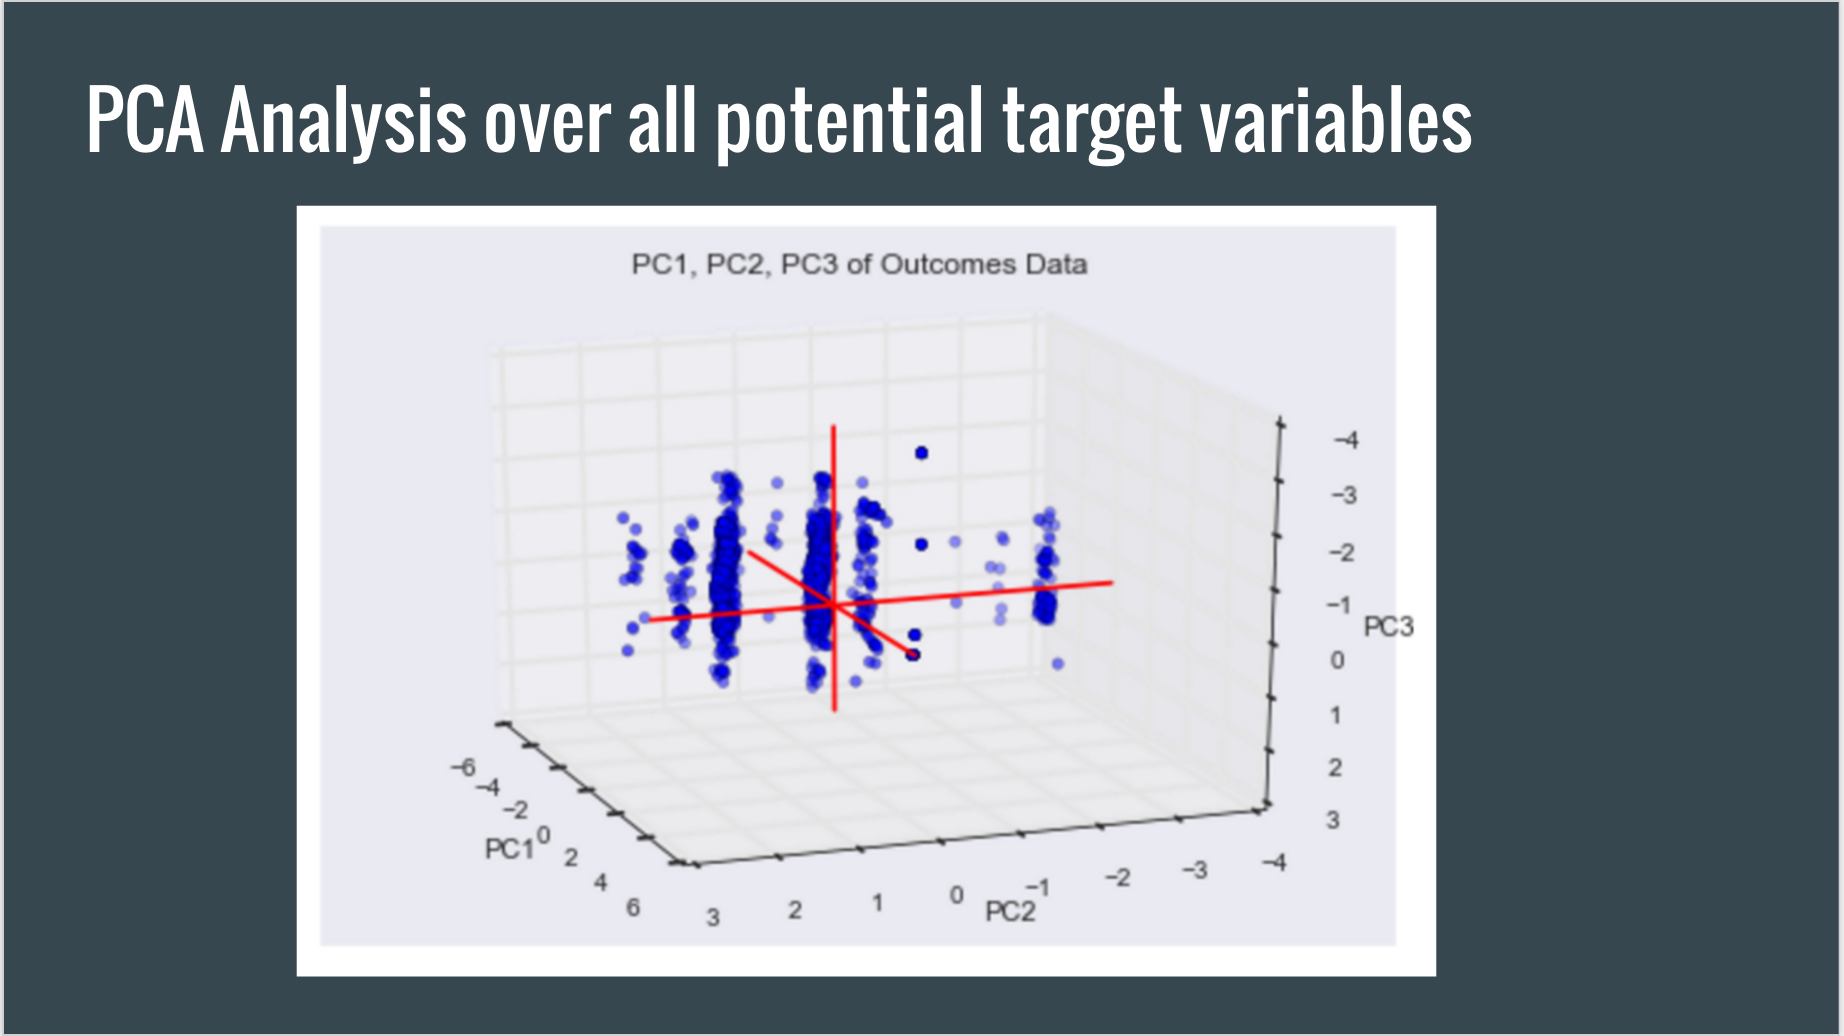
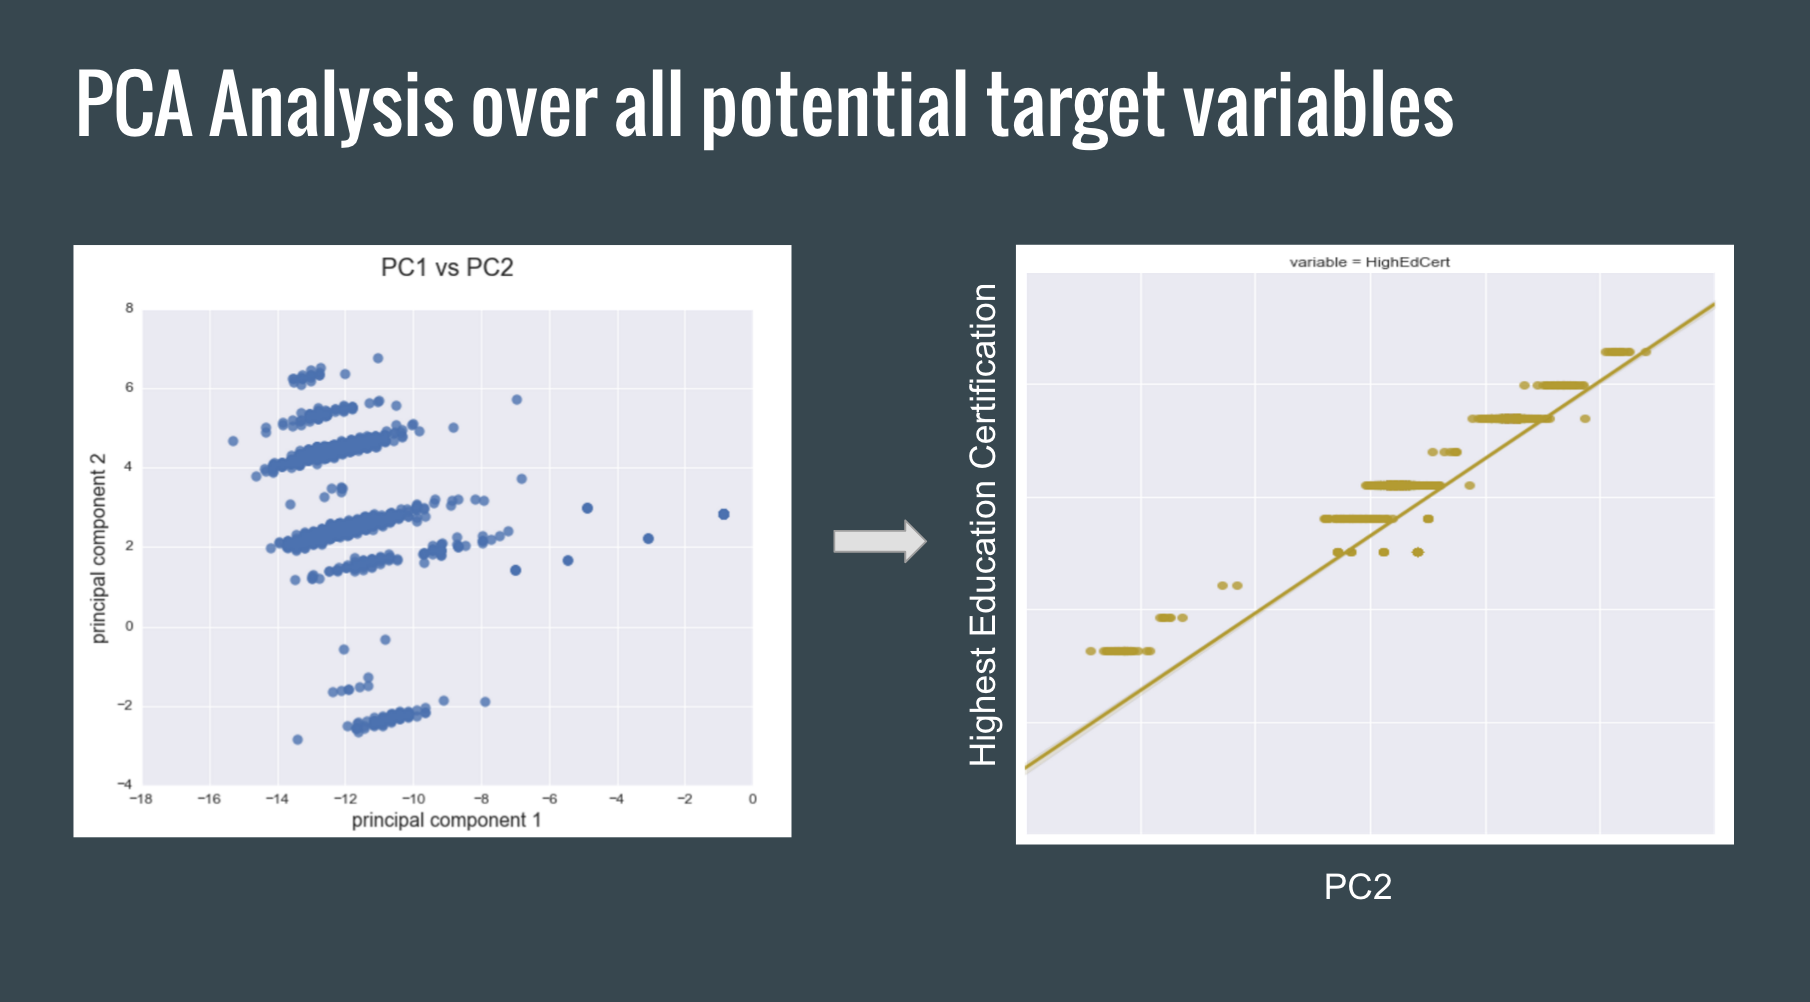
The surveys administered to the foster youth to obtain outcomes data yielded many target variables. As can be seen above, I first attempted to group the data into four main outcome variables: well-being, health, educational, and financial outcomes. However, I still had to decide on one y-variable to focus the model on. I decided to conduct a PCA analysis and discovered that there was one main outcome that was explaining the majority of the variance in the data: Higher Education Certification. In other words, the PCA analysis over all the outcomes data (target variables) revealed that educational attainment was a proxy for all other outcomes. See diagrams below:
– Selecting Features –
Soon to come: Selecting features, building the model, and recommendations.