
Web Scraping & Logistic Regression -- Predicting High/Low Salary for Job Posts on Indeed.com
Executive Summary
The aim of this report is to discuss logistic regression models that predict whether a salary for a job posting on Indeed.com will be high or low. Most job postings do not include salary information. The goal of the project is to use job postings with salary information to build a model that would predict whether salaries for job postings without listed salaries would be high or low. Data was scraped from Indeed.com, cleaned and prepped for fitting of logistic regression models. Models were then evaluated and tuned. The results indicate that more data needs to be scraped and certain data cleaning and organization methods need to be revisited and issues need to be addressed. The report concludes that although predictions of high or low salaries are possible, the way that certain categorical variables are bucketed or organized will heavily impact the prformance of the models. It is recommended that further analysis should be put on hold until enough data is gathered and specific data organization issues are addressed.
Introduction
Although most job listings do not come with salary information, salary information that is available can be used to extrapolate expected salaries for other listings. One way to gauge salary amounts is to take a look at what industry factors influence the pay scale for specific professionals and determine what leads to high/low salary.
In this project, I collected salary information on data science jobs in a variety of markets. Then using the location and title of the job, I attempted to predict a corresponding salary classification (high or low) for that job.
Aggregators like Indeed.com regularly pool job postings from a variety of markets and industries. By using data collected by scraping Indeed.com, a binary predictor with Logistic Regression was built to find factors that most directly impact data science salaries in metro regions.
Methods
First I acquired data from Indeed.com by utilizing Beautiful Soup, a Python package for parsing HTML documents, to scrape the website for job postings and their details (location, company, salary if any, etc.). I decided to scrape job postings for cities that were listed in a Forbes article as the top ten most innovative tech hubs in 2015 (see article here: http://www.forbes.com/sites/kathryndill/2015/02/12/the-10-most-innovative-tech-hubs-in-the-u-s/#ac0adc1386db) as well as other well-known tech hubs. I purposely excluded any sponsored job listings as well as postings with no salaries. Listings with monthly and hourly wages were also excluded because of the high probability that they were not full-time jobs.
For salary ranges, I took the average and used that value. If a more conservative model is desired, the lower end of the ranges should be utilized. If a more competitive model is desired, the higher end of the ranges should be used.I obtained the median salary of those listings, and created a dummy variable that signified whether a salary was above or below the median (high or low).
Target variable was set as the high/low indicator variable. The features explored as the factors that determine high/low salaries were the locations (cities) and actual job titles of the listings. If the job title included the words senior or lead (or the abbreviation sr), they were categorized as ‘Lead’. If the job title included the word analyst or scientist, they were categorized as either ‘Analyst’ or ‘Scientist’. All other job titles were categorized as ‘Other’. Dummy variables were then created for these classifications.
I then built a binary predictor by first using the Train-Test-Split method on the data. Then a logistic regression model was fit to the data and then used to predict the probabilites of the target variable (high or low salary classification) based on the features used in the model. Several models were explored, tuned, and evaluated using the following metrics: confusion matrix, classification report, ROC/AUC, and cross validation score.
Results
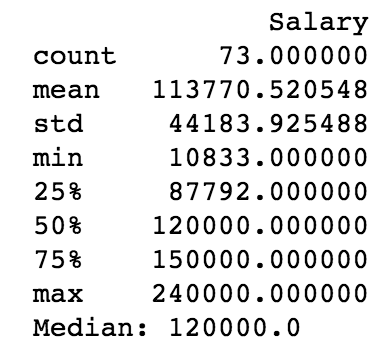
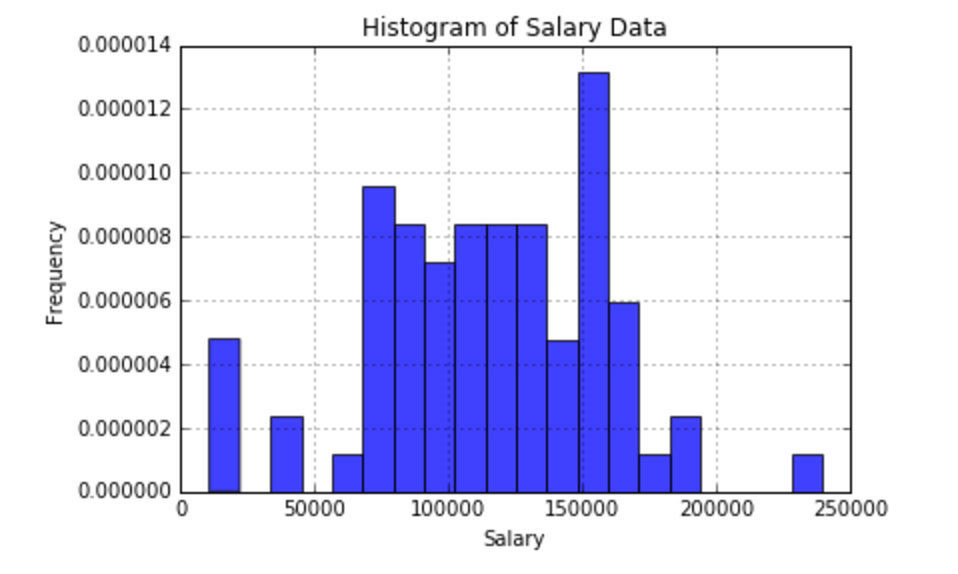
After scraping up to 100 results per city (for a total of 14 cities), I ended up with a dataset of 73 job postings with listed salaries (out of ~2000 total listings). Average salary was $113,771 and median salary was $120,000. See the descriptive statistics below as well as a histogram of the scraped salaries.
The following models were produced:
-Logistic Regression Model with all features
-Logistic Regression Model with all features, with L1 penalization
-Logistic Regression Model with only job title features
Model Evaluation:
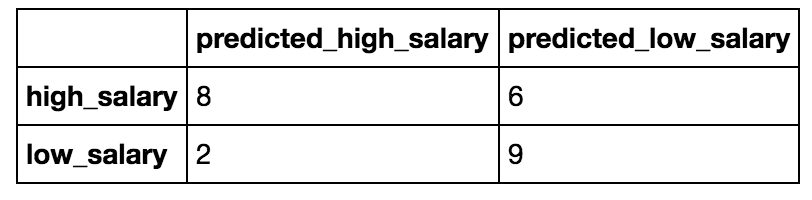
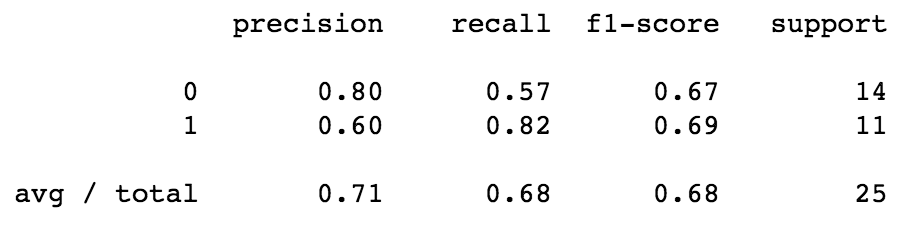
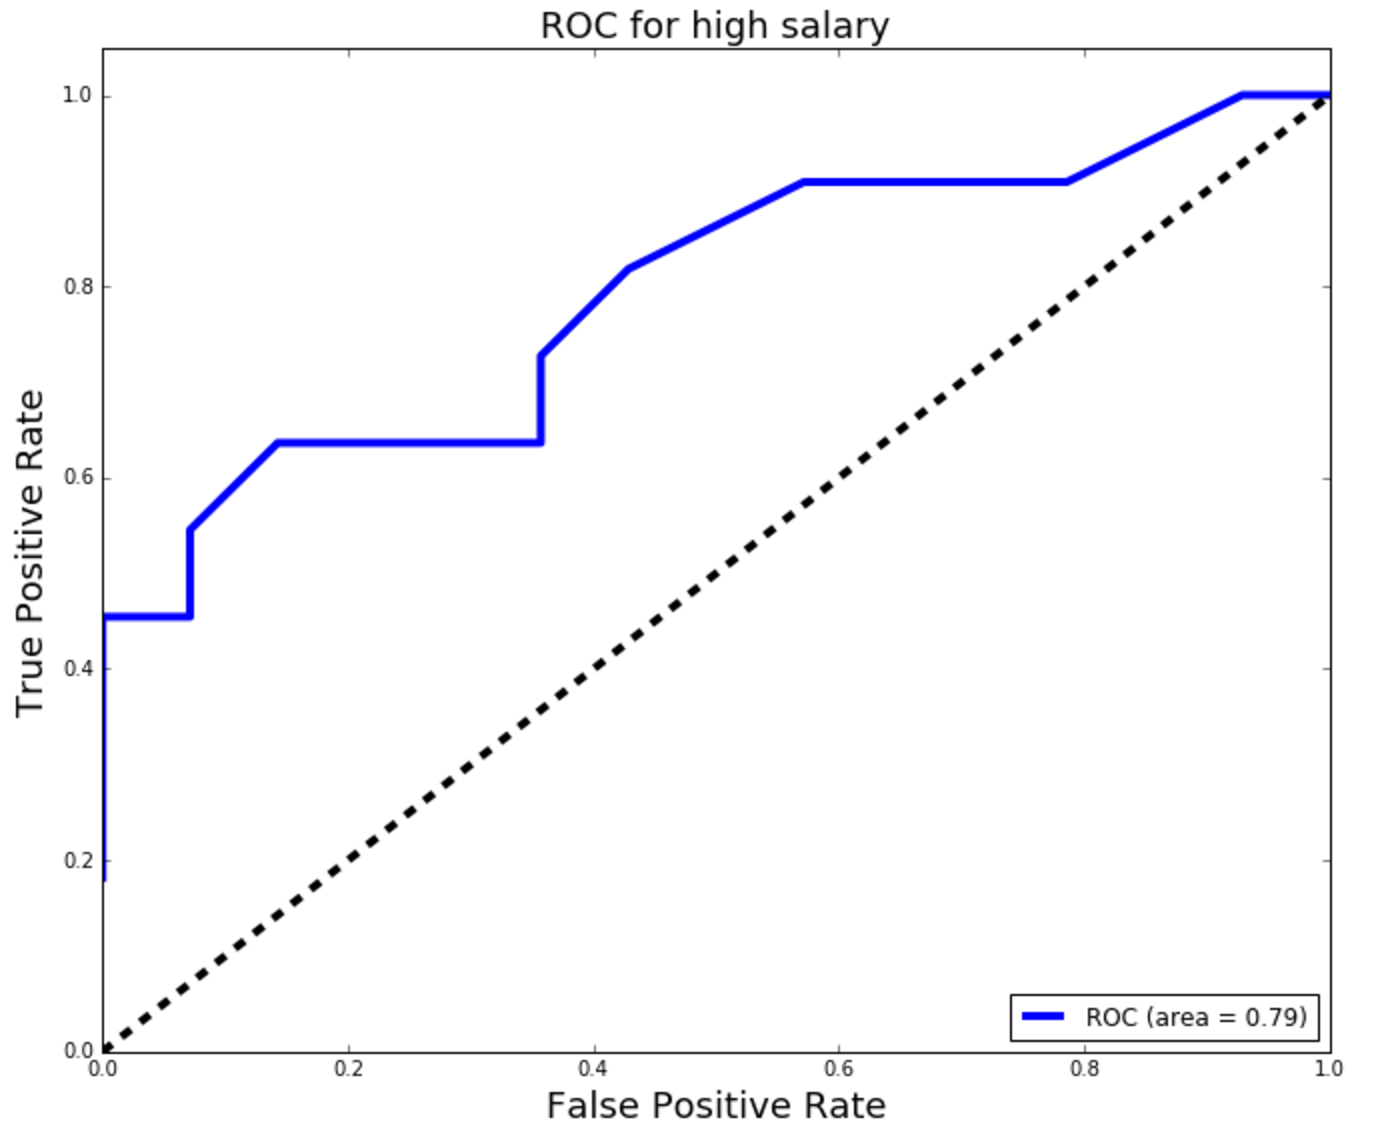
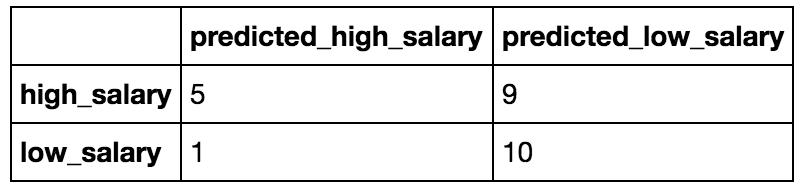
Model 1: Logisitic Regression Model with all features (location and job title variables):
Confusion Matrix:
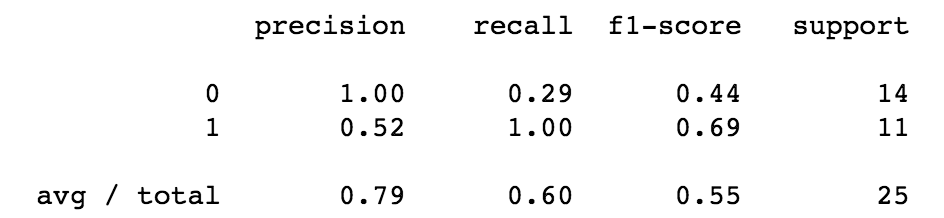
Classification Report:
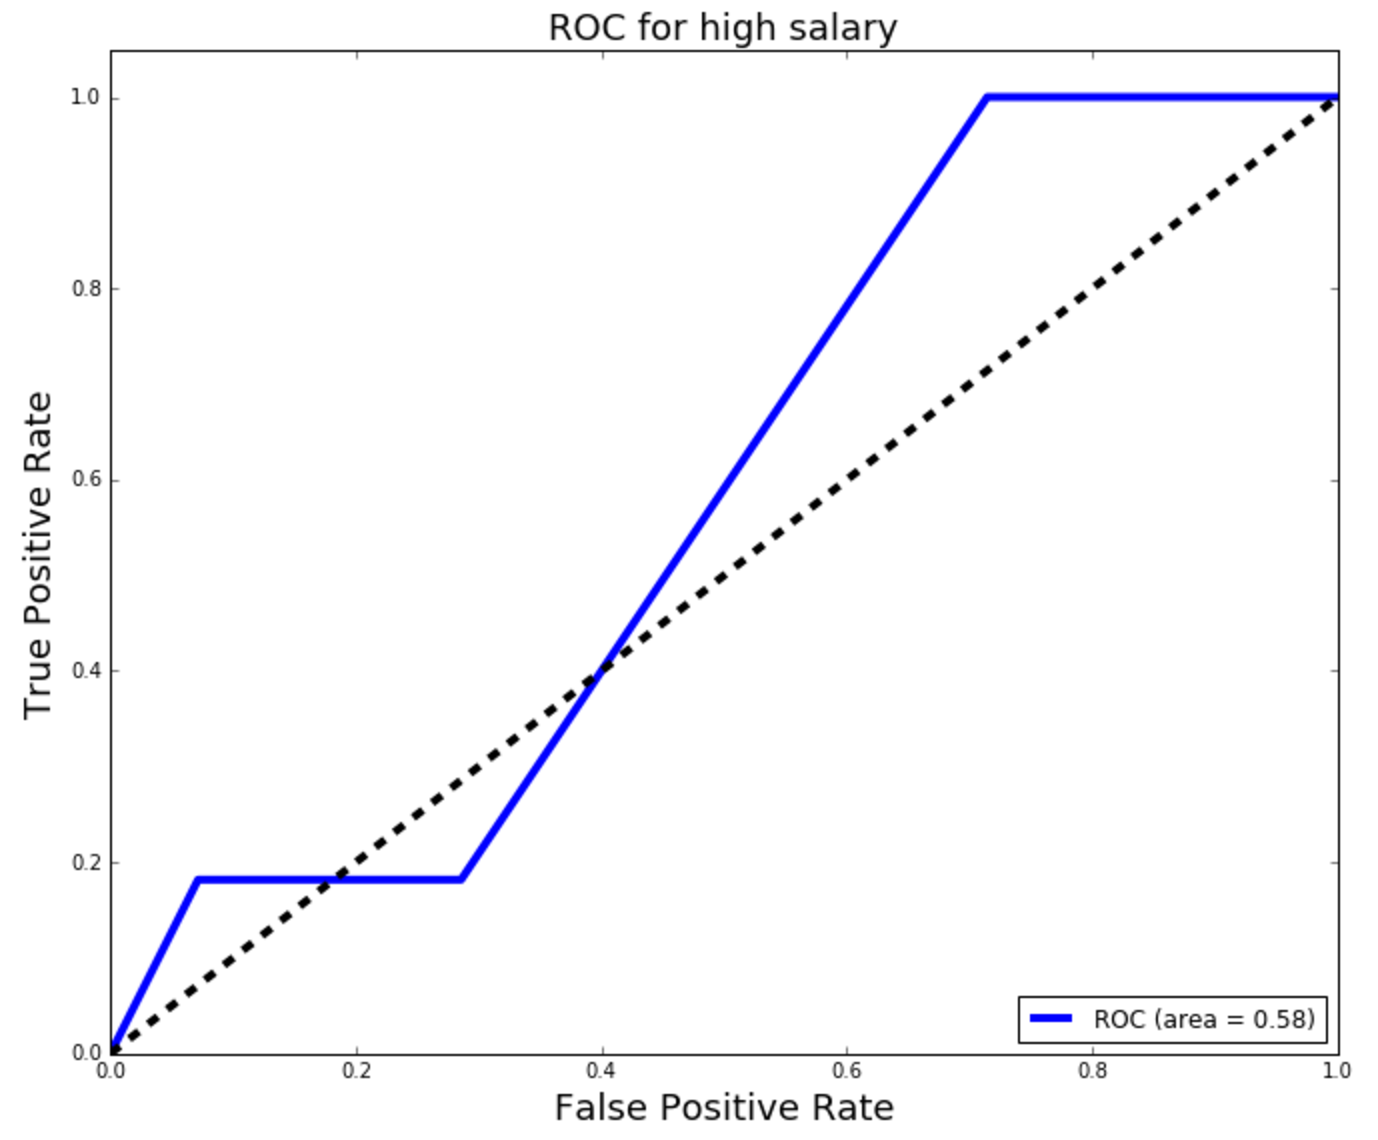
ROC/AUC:
  Cross Validation Score (mean of accuracy scores of model):

  0.61611111111111116
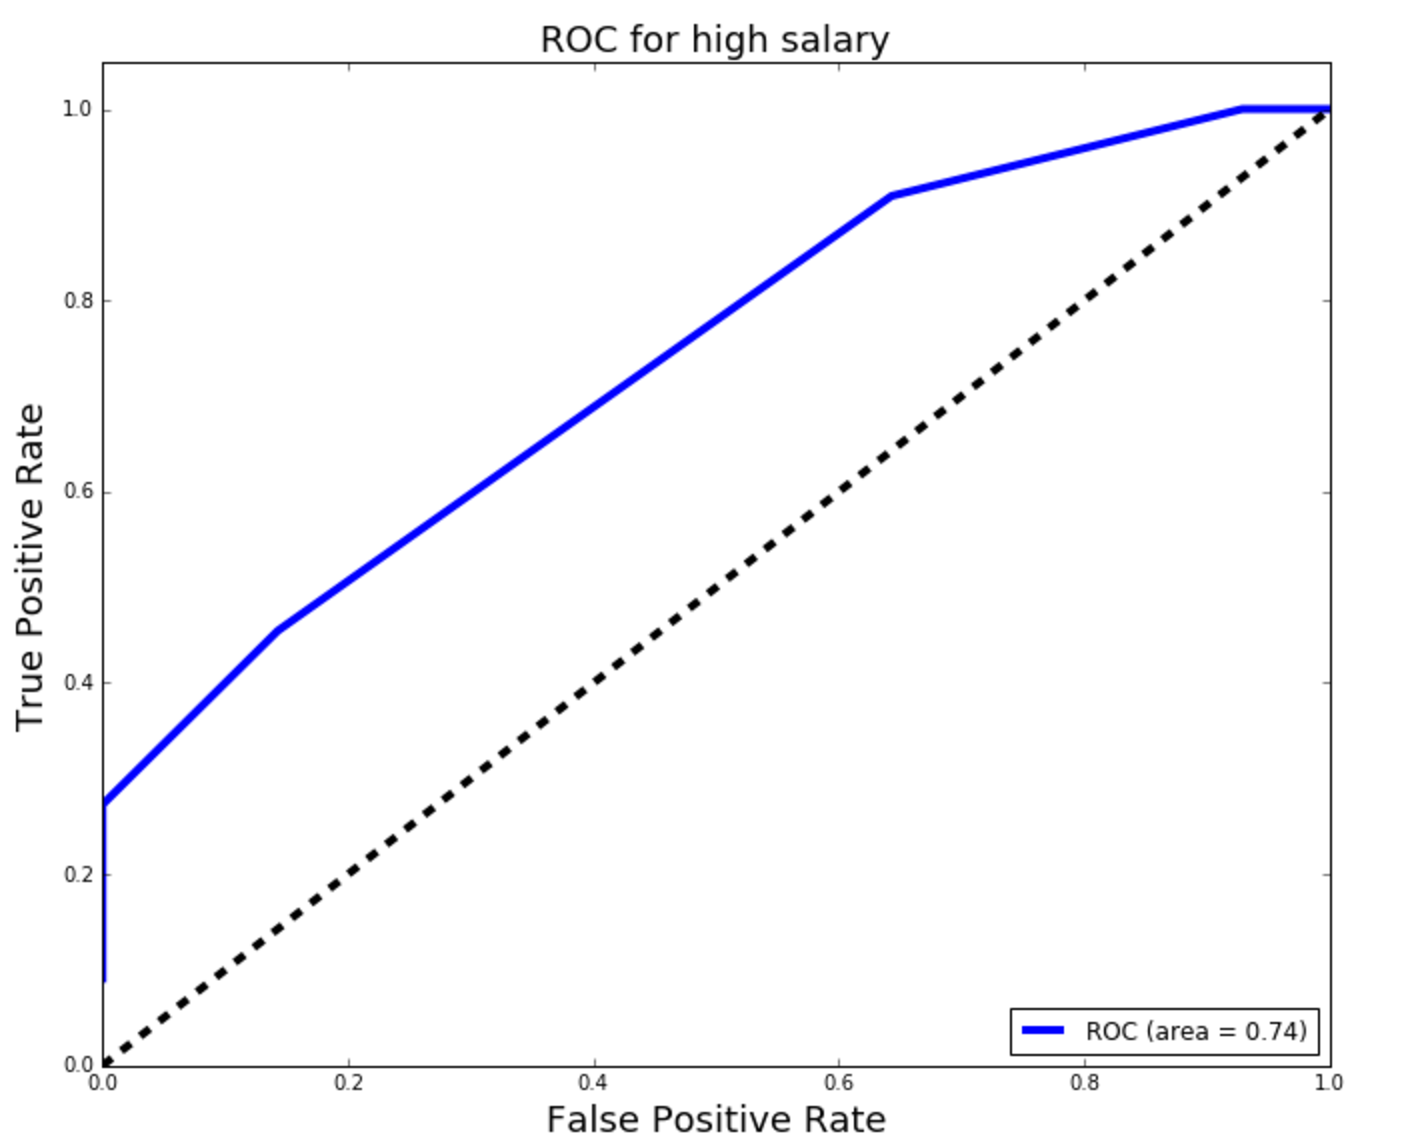
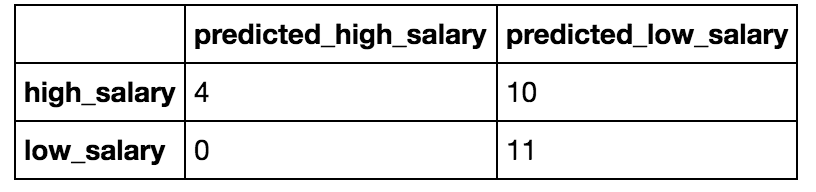
Model 2: Logisitic Regression Model with all features (location and job title variables) and Lasso Regularization:
Confusion Matrix:
Classification Report:

ROC/AUC:
  Cross Validation Score (mean of accuracy scores of model):

  0.60222222222222221
Model 3: Logisitic Regression Model with only job title features (whether job listing was for lead, analyst, scientist or other position):
Confusion Matrix:
Classification Report:
ROC/AUC:
  Cross Validation Score (mean of accuracy scores of model):

  0.60222222222222221
Discussion / Interpretation of Results
It can be seen from the results in the visuals above that model 1, Logisitic Regression Model with all features (location and job title variables), was the best performing model of the three explored. The precision and recall scores, the area under the ROC curve, and the cross-validation score were the best for this model. However, looking at the confusion matrix, one can see that not many predictions were obtained from the model. This is mainly due to the very small sample size.
Conclusion
In order to obtain an accurate model, I need to go back and fix certain data issues. Only then can I attempt to build a powerful model and obtain meaningful results.
Recommendations
The next steps listed below are recommended before any further analysis can be conducted:
• Obtain more data
• Fix categorization of job titles:
As of now, any job title with keywords lead, sr, senior will be bucketed as sr_type regardless of analyst and scientist keyword. Should aim to make two seperate dummy variables: one for senior/manager titles, and one for actual job title (analyst, engineer, etc.)
• Recategorize Location by region
• Explore the following model: Logistic Regression Model with only location features
• Continue tuning model
• Evaluate model using Logistic Regression CV