
Disaster Relief + Classification -- Predicting Likelihood of Survival of a Passenger on the Titantic
Executive Summary
The aim of this report is to explore classification models that use historical data to determine what factors predicted whether a passenger on the Titanic survived or not. The goal of this project is to demonstrate the capability to analyze a disaster incident and produce a predictive model for likelihood of survival. Such a model would allow for decisions based on predictions, and thus maximize the mitigation of risk or damage from disasters. Data on Titanic passengers was accessed through a remote database, cleaned and prepped for fitting of several classification models. Models were then evaluated and tuned using GridSearch CV methods. The results indicate that certain features were more significant than others (namely passenger gender, class, and family size. The best classification model was a GridSearched kNN model with the following parameters:
knn_model = KNeighborsClassifier(algorithm =’auto’, leaf_size = 30, metric = ‘minkowski’, metric_params = None, n_jobs= 1, n_neighbors = 5, p = 2, weights = ‘uniform’)
The report concludes that likelihood of survival of passengers of the Titanic can be accurately predicted with properly prepped data and a kNN classifier. Titanic passengers who were female, from passenger class 1, and part of a small (1 - 3 relations) family. It is recommended that future analysis include the feature of cabin number (which is probably a proxy for likely location on the Titanic, which may be an important feature considering survival).
Introduction
Frequently after a disaster, researchers and firms will come in to give an independent review of an incident. Even if these agencies do not have current client data that it can use to test and deploy models, they can use historical data to create models for future purposes. In this post, I will demonstrate how data from the 1912 titanic disaster stored in a remote database can be used to test and deploy predictive models, particularly classification models, for disaster analysis.
In this project, I set up a connection to a remote database and conducted querys (using Python). After performing EDA, I proceeded to construct a logistic regression model as well as a kNN model and test/validate their results. Using several features of a passenger, I attempted to predict a corresponding classification (survivor or non-survivor) for that passenger.
Methods
First I acquired data from a remote database by setting up a connection and reading the SQL table into a pandas DataFrame using Python. The following snippet provides the initial risks and assumptions observed:
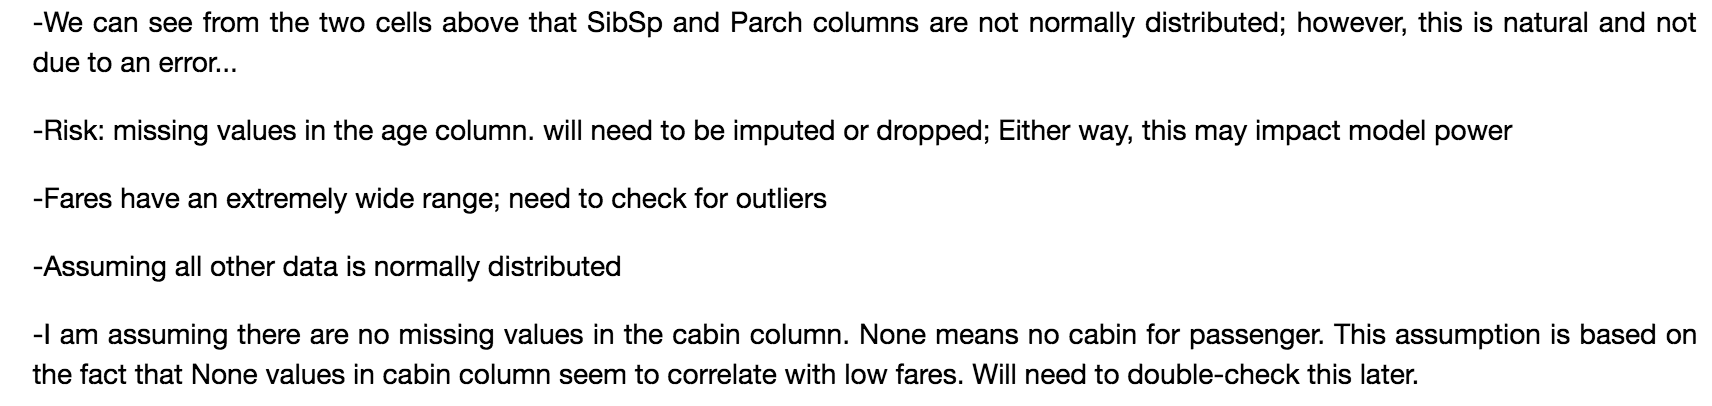
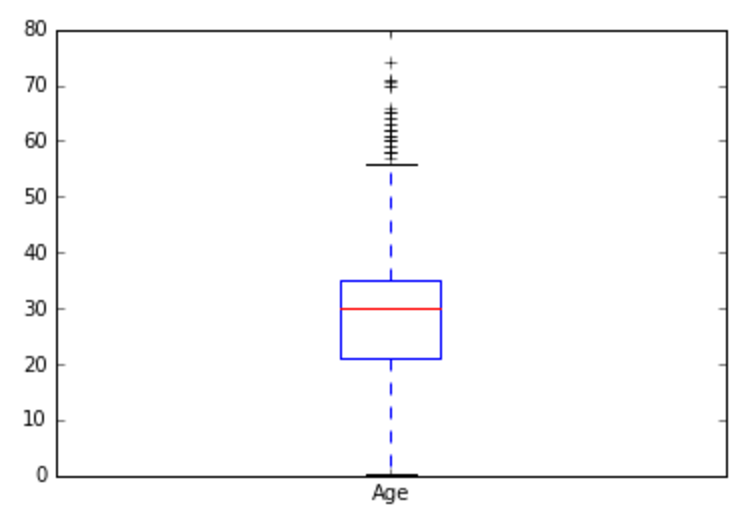
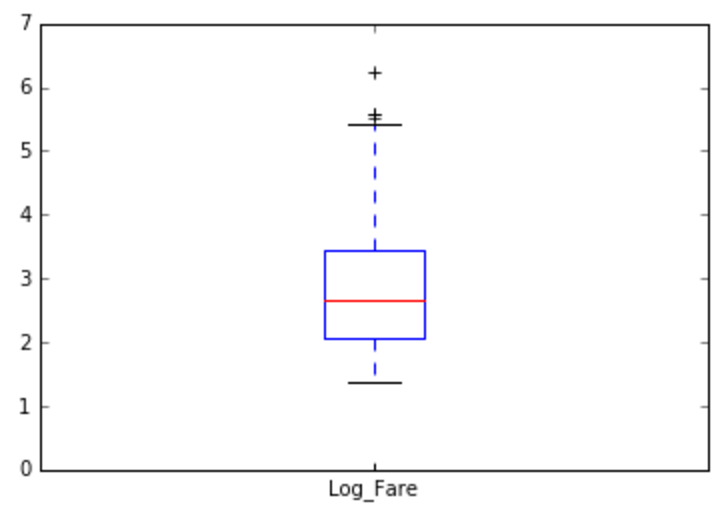
I decided to impute missing values for ages based on a passenger’s salutation group (i.e., ‘Mr.’, ‘Mrs.’, ‘Ms.’, and ‘Master’). I determined the median ages of passengers grouped by their salutations, and replaced missing age values with those median values according to their salutation. I transformed the ‘Fare’ variable by creating a column for the log values of the (non-zero) fares for each passenger. I treated the ‘Fare’ column this way in order to address natural outliers found in the data.
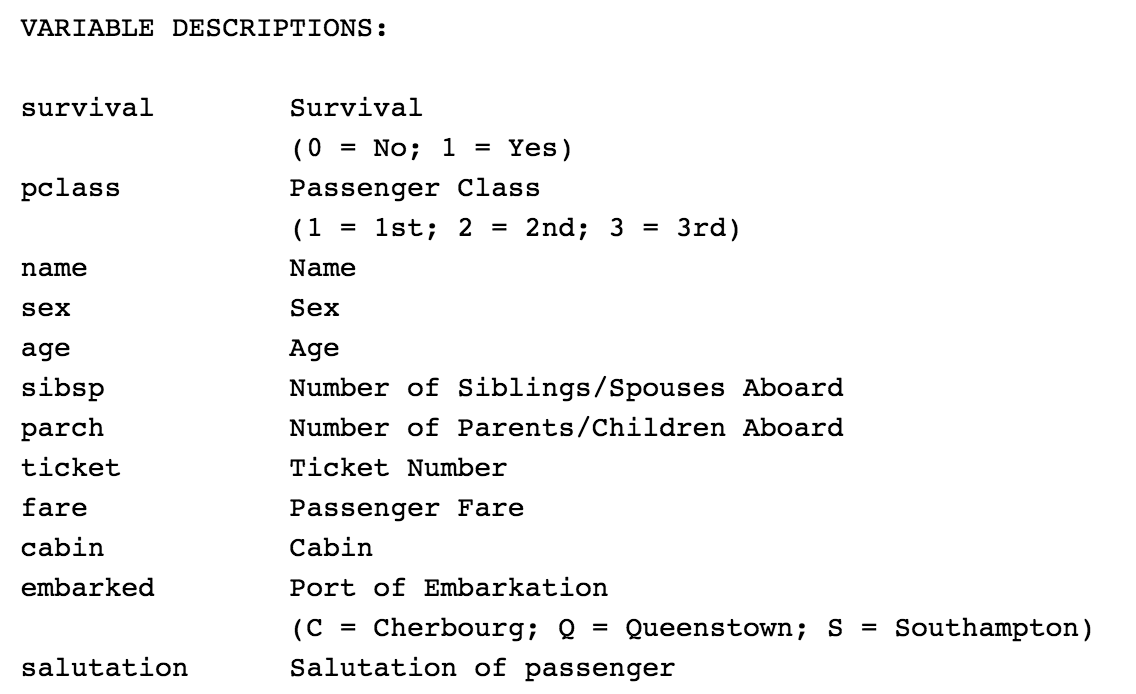
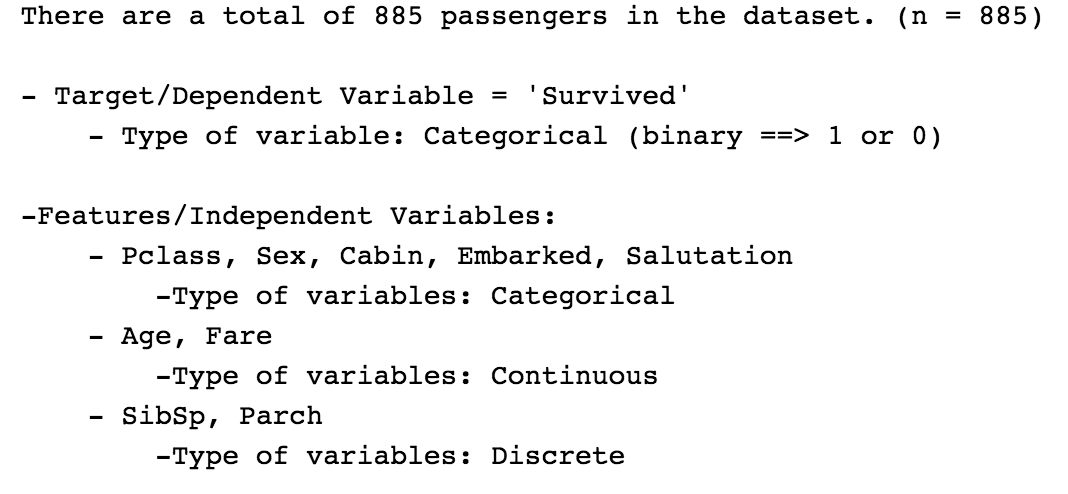
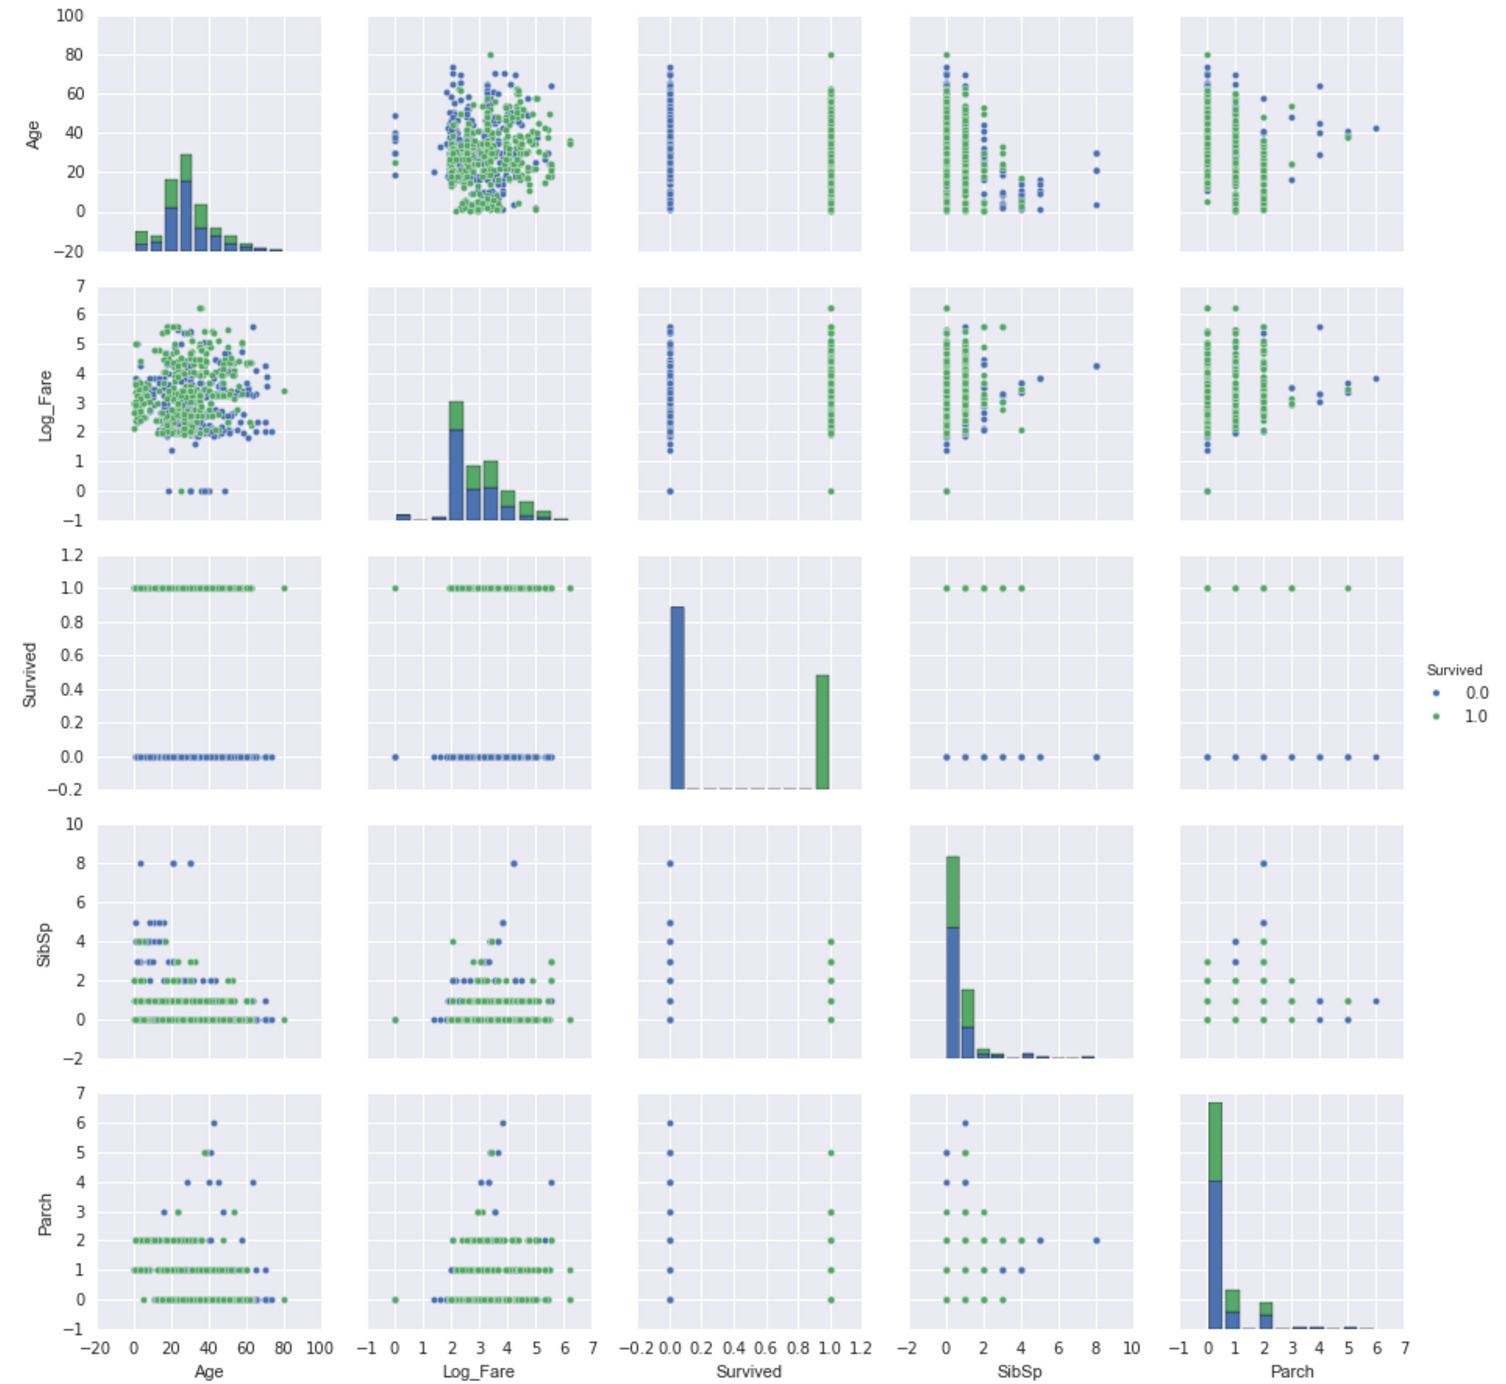
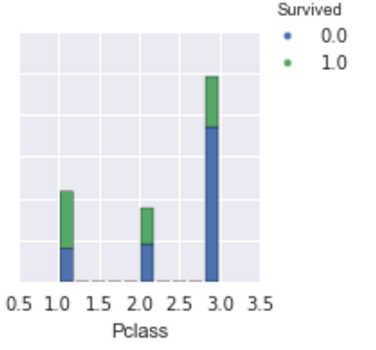
Target variable was set as the ‘Survived’ indicator variable, which was already an existing variable in the dataset. After performing exploratory data analysis (EDA), the features selected to be included in the model as the predictors that determine passenger survival were as follows: gender, passenger’s class, the log values of each passenger’s fare (unless zero–then zero was used as value), the number of siblings or spouses a passenger had, the number of parents or children the passenger had, and age of passenger. I created dummy variables for gender categories.
See data dictionary below:
I then built several logistic regression models and one kNN model using several methods. Each model was evaluated based on their accuracy scores and other metrics.
1) I first built a 'vanilla' logistic regression model, not specifying any parameters and not training the model.

2) I then built a logistic regression model, using Train-Test-Split method to test and validate model.

3) I then built a cross-validated logistic regression model, using 5 k-folds.

4) I then built a grid-searched, cross-validated logistic regression model, in which GridSearch CV in sklearn was used to indentify the optimal hyperparameters for the model.

5) I then built a grid-searched kNN classifier model, in which GridSearch CV in sklearn was used to indentify the optimal hyperparameters for the model.
These models were explored and evaluated using the following metrics: confusion matrix, classification report, ROC curve/AUC, and cross validation score (which was the average accuracy score for the models).
Results
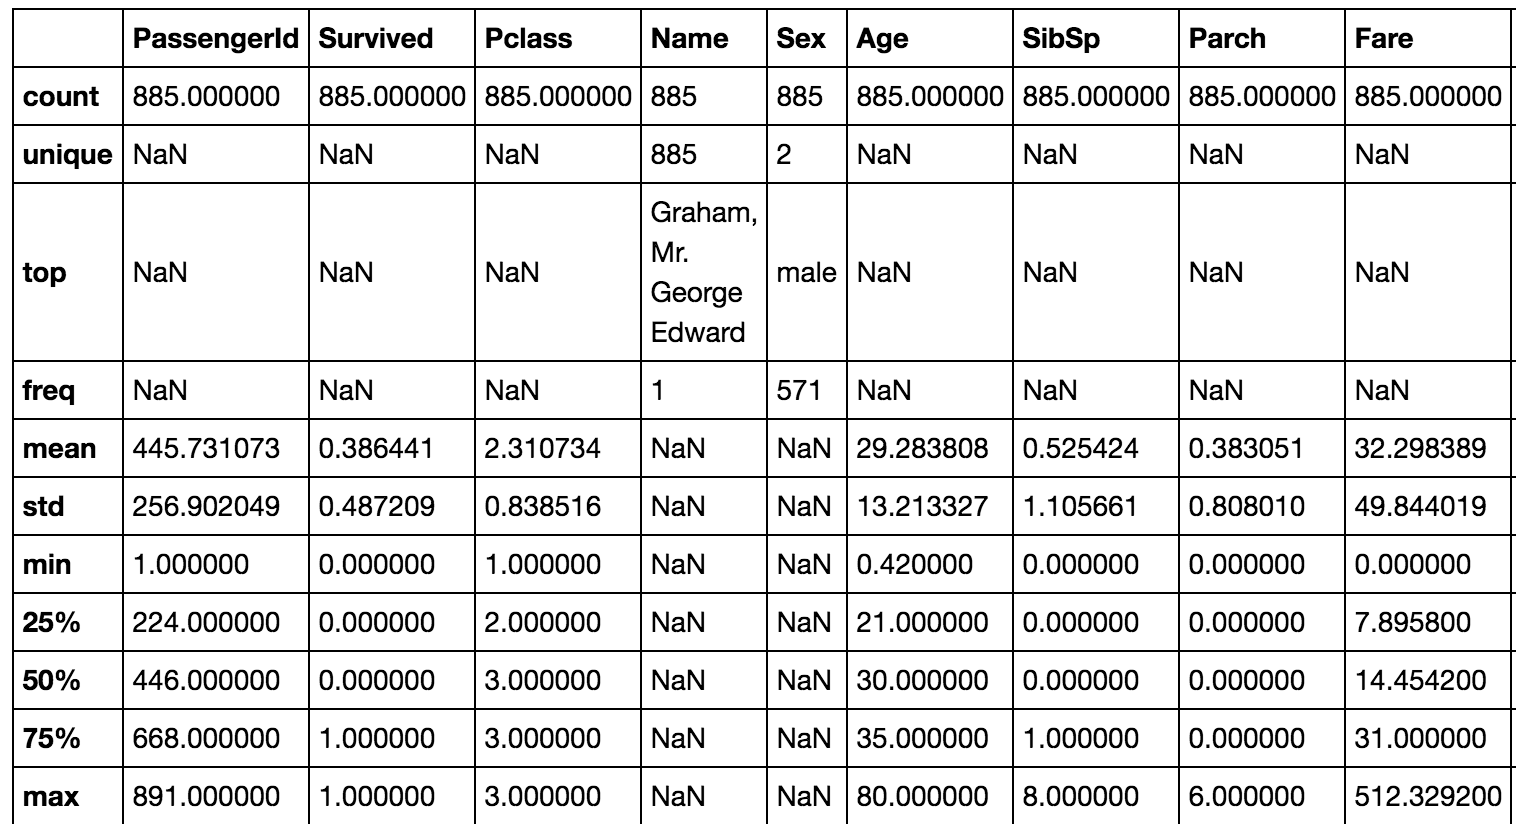
After cleaning the dataset, I ended up with a dataset of 885 passengers of the Titanic. Of the 885 passengers, 543 did not survive (62%). See the descriptive statistics below as well as some univariate and bivariate visualizations of the data.
Model Evaluation: Of the five models built, the model with the highest accuracy score was the kNN classifier that was built using optimal parameters that were determined using gridsearch methods from the scikit learn library. For this post, I am displaying the confusion matrix, classification report, and ROC curves (with AUC) for two models–the kNN classifier and the cross-validateed logistic regression model.
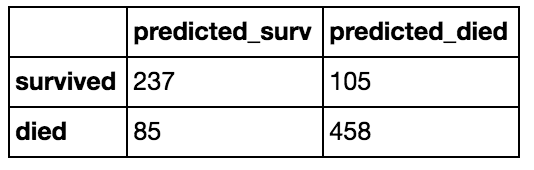
Model 1: CV Logisitic Regression Model with gender, pclass, age, fare and family size features:
Confusion Matrix:
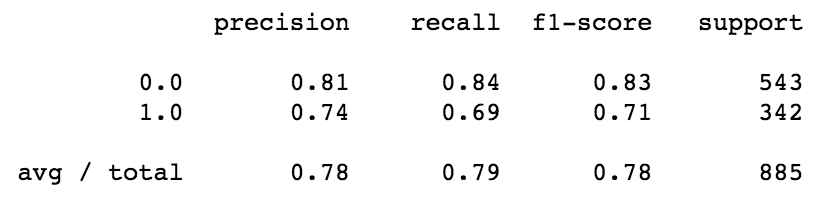
Classification Report:
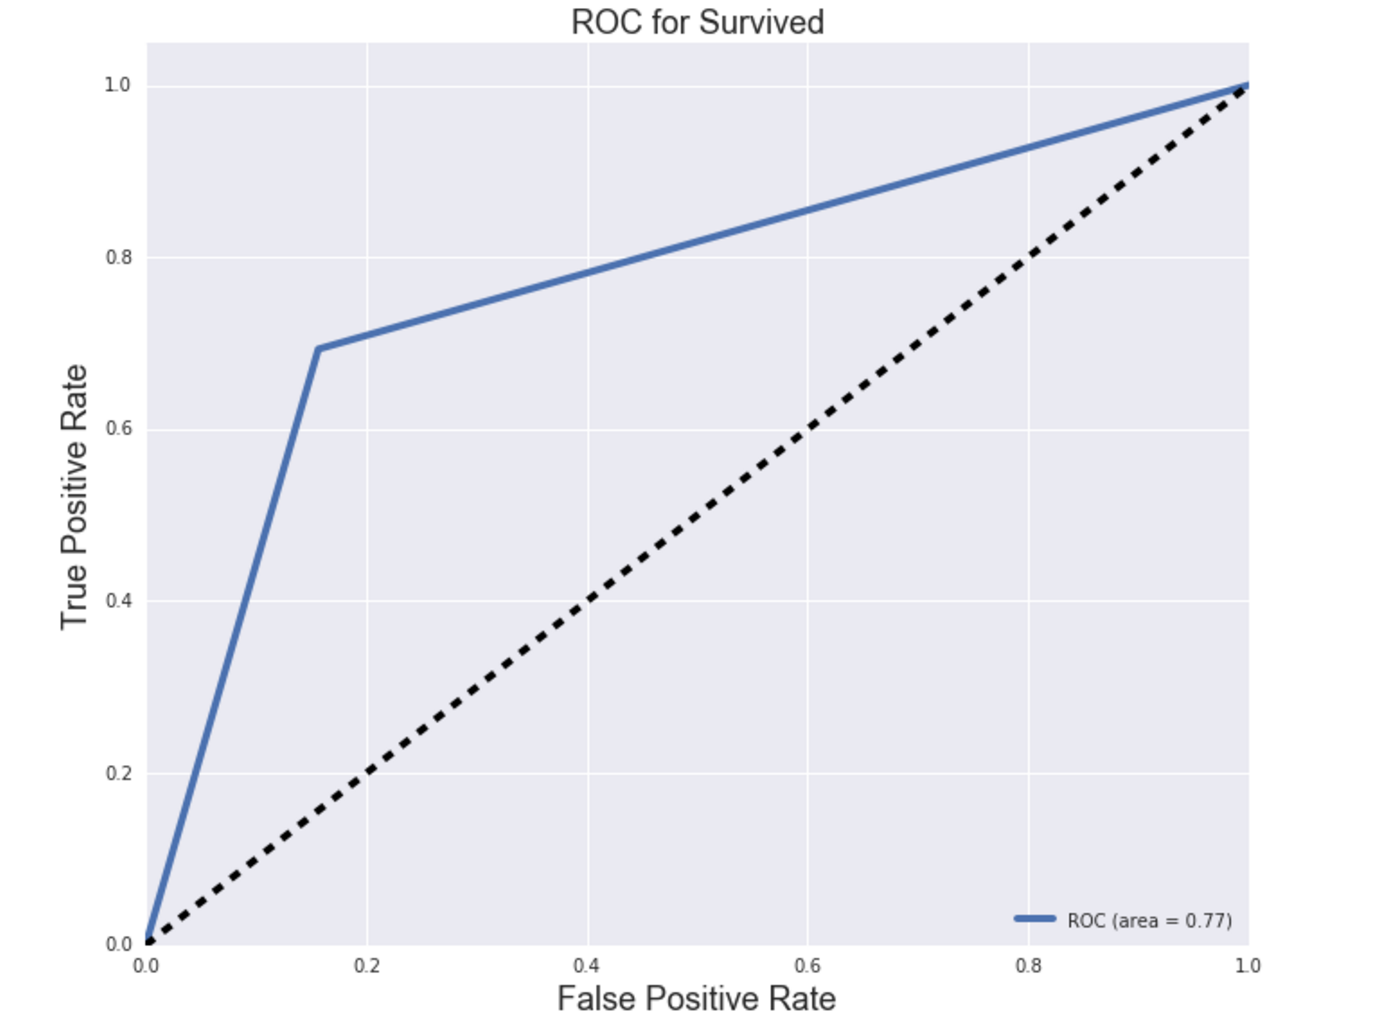
ROC/AUC:
  Cross Validation Score (mean of accuracy scores of model):

  0.78534355649428966
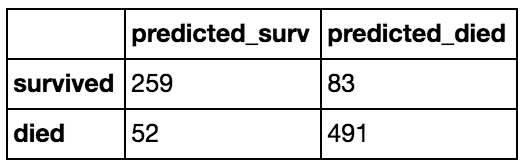
Model 2: Gridsearched CV kNN Classifier Model with gender, pclass, age, fare and family size features:
Confusion Matrix:
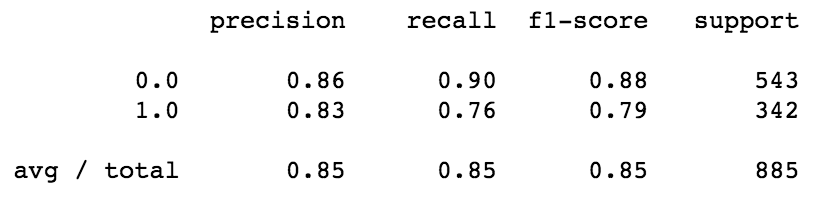
Classification Report:
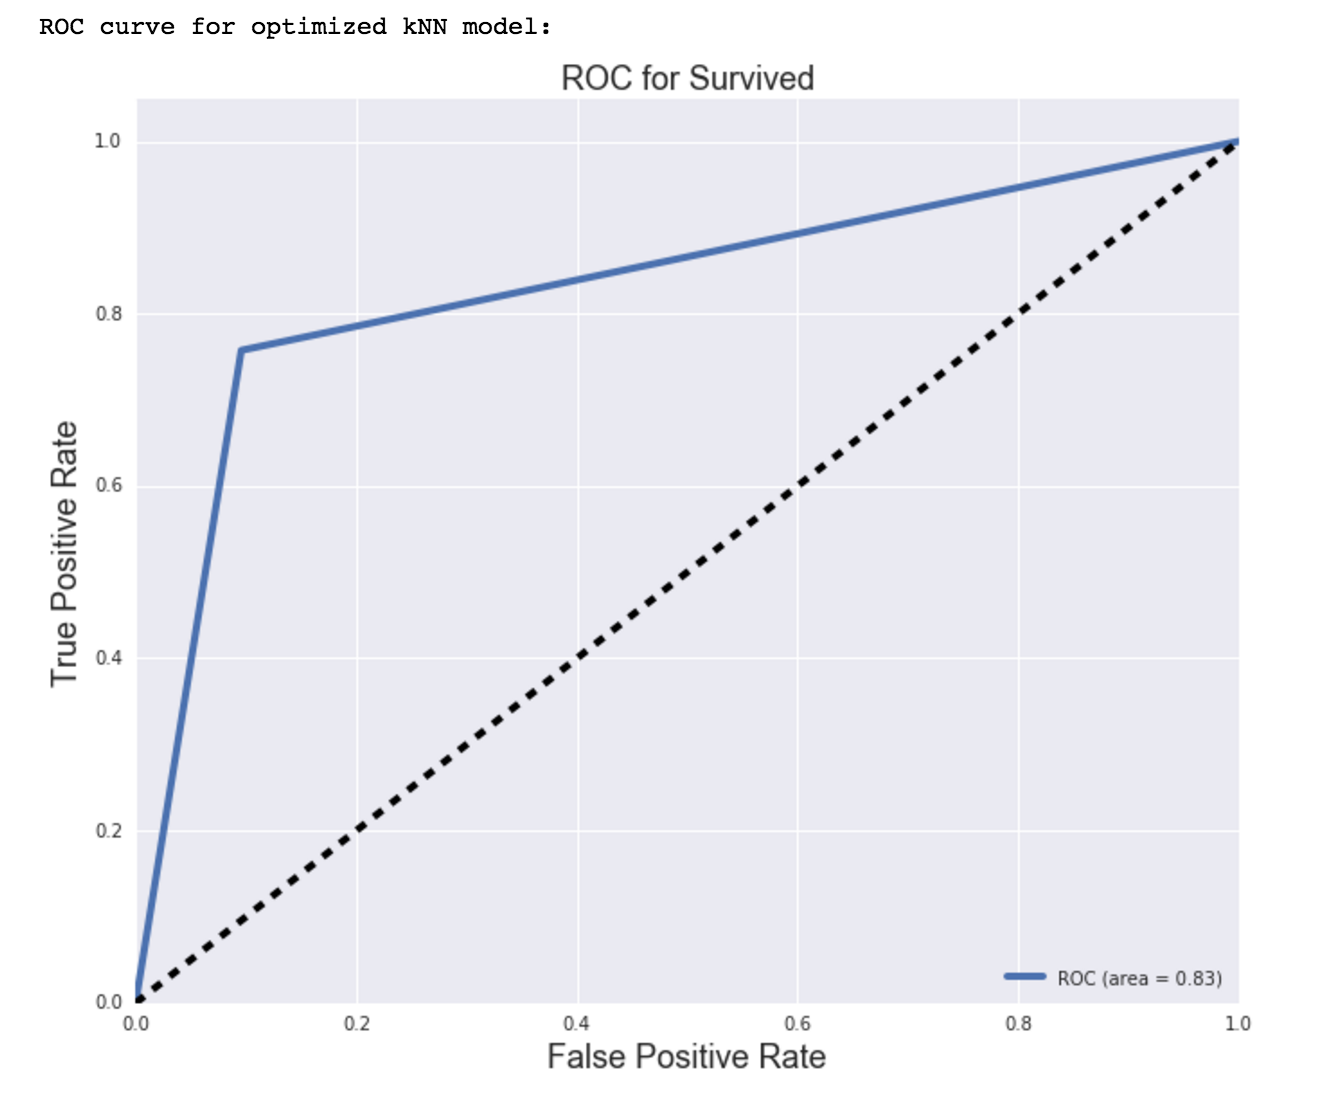
ROC/AUC:
  kNN accuracy score of model with optimal parameters:

  0.84745762711864403
Discussion / Interpretation of Results
The results from the logistic regression models (in particular, the magnitude of the coefficients of the features) indicate that certain features were more significant than others (namely passenger gender, class, and family size). The best classification model, based on accuracy scores as well as other metrics of models, was a GridSearched kNN model with the following parameters:
knn_model = KNeighborsClassifier(algorithm =’auto’, leaf_size = 30, metric = ‘minkowski’, metric_params = None, n_jobs= 1, n_neighbors = 5, p = 2, weights = ‘uniform’)
The optimal kNN model performed better than the logistic regression models in accuracy/goodness of fit, precision, recall and f1-score.
Interpreting the Classification Report:
Precision answers the question of how many passengers actually survived out of the total number of passengers predicted to have survived. Model 1 has a precision score (for label 1.0–survivor) of 0.74 ==> 74% of the predicted survivors actually survived. Model 2 had a precision of 0.83.
Recall answers the question: Out of all the passengers that survived in the dataset, how many were predicted to have survived. Model 1 has a recall score (for label 1.0–survivor) of 0.69 ==> Model 1 was able to identify 69% of all actual survivors. Model 2 had a recall of 0.76.
The f1-score tells us the balance between precision and recall, which is the model’s accuracy. We have already checked the accuracy score with the cross-validation above. An f1-score reaches its best value at 1 and worst score at 0. Model 1 had an f1-score of 0.71, while Model 2 had an f1-score of 0.79.
The support number is the number of occurrences of each class in y_true (in this case, y). The full dataset was used for both models since the data was trained and tested using cross-validation in both models.
Interpreting the Confusion Matrix:
The confusion matrix tells us the actual numbers, or layout, for true positives (predicted as survived and actually survived), false positives (predicted as survived but did not actually survive), true negatives (predicted as non-survivor and actually died), and false negatives (predicted as non-survivor but did not actually die) that were predicted by the model. These numbers are the ones used to calculate precision and recall (and subsequently, f1-score/accuracy and support numbers).
Interpreting ROC curve and AUC of model:
ROC (Receiver Operating Characteristic) curve visualizes the performance of a binary classifier model, like the model in this analysis. It is a plot of the True Positive Rate on the y-axis (aka recall ==> TPR = TP/(TP + FN), versus the False Positive Rate on the x-axis (FPR = FP/(FP + TN) for every possible classification threshold. The threshold determines the weight of sensitivity (recall) and specificity, and default is usually 50% for each (equally weighted). The AUC metric, or area under the curve, of the ROC curve is the accuracy of the model. It is the performance score, or overall measure of fit, of the model at the set threshold. Both ROC curves for Model 1 and Model 2 have a sharp elbow, which indicates a clear separation of survivors and non-survivors predicted. This may be how I went about training and testing the data, and validating the models. Will need to look into this further. The AUC, or accuracy, for Model 2 was better than that of Model 1 (0.83 > 0.77).
Conclusion
The best classification model was a GridSearched kNN model with the following parameters:
knn_model = KNeighborsClassifier(algorithm =’auto’, leaf_size = 30, metric = ‘minkowski’, metric_params = None, n_jobs= 1, n_neighbors = 5, p = 2, weights = ‘uniform’)
The report concludes that likelihood of survival of passengers of the Titanic can be accurately predicted with properly prepped data and a kNN classifier. Titanic passengers who were female, from passenger class 1, and part of a small (1 - 3 relations) family.
Recommendations
It is recommended that future analysis include the feature of cabin number (which is probably a proxy for likely location on the Titanic, which may be an important feature considering survival). Furthermore, future analysis should address, or at least discuss, the issue presented in the Sibling/Spouse and Parent/Child varaibles. There is no way to seperate the sibling relations from the spouse count and parent count from children count. This may impact the importance of these features in the model.
More importance (or less) may be drawn out from continuous features (such as age and fare) if bucketed/transformed to categorical variables. However, passenger class seems to serve as decent proxy for fare. Perhaps future models that are explored should exclude the fare variable.